Fig. 7
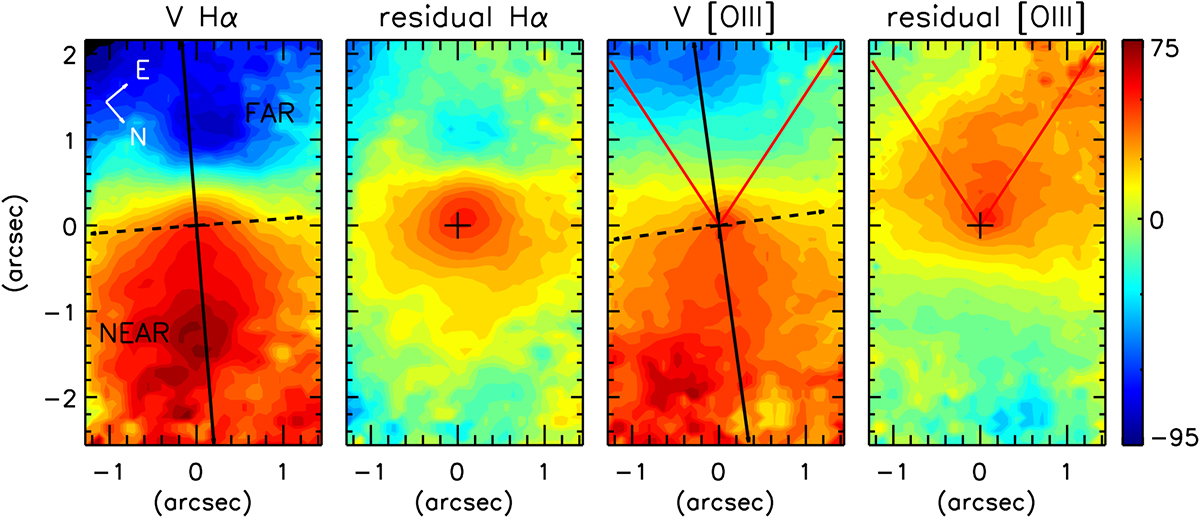
Emission line gas velocity fields and residual velocity fields (observed – [N II] model) for Hα and [O III]. Panels 1 and 3 show the gaseous centroid velocities (km s−1) obtained from a single Gaussian fit. The cross denotes the location of the stellar continuum peak, and the solid and dashed lines delineate the major and minor kinematic axes as derived using kinemetry (Sect. 3.3). For the [O III] velocity map(and residual velocity field) the red lines denote the bounds of the ionization cone; we use an opening angle of 70° in agreementwith the value (≥60°) proposed by Fraquelli et al. (2000). All panels follow the colour bar (km s−1) shown on the right.
Current usage metrics show cumulative count of Article Views (full-text article views including HTML views, PDF and ePub downloads, according to the available data) and Abstracts Views on Vision4Press platform.
Data correspond to usage on the plateform after 2015. The current usage metrics is available 48-96 hours after online publication and is updated daily on week days.
Initial download of the metrics may take a while.