Fig. 5
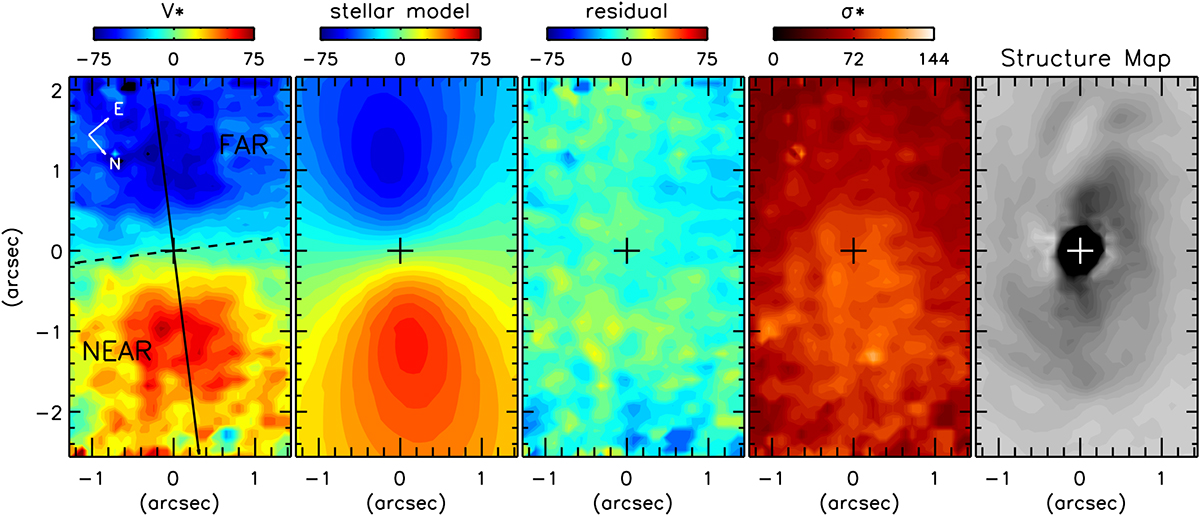
Stellar velocity field, stellar rotation model, residual velocity field (observed – model), stellar velocity dispersion (all in units of km s−1 following the colour bars above panels), and the structure map (the bright nucleus masked to show details better at fainter fluxes) for ESO 362-G18. In the left panel the solid (dashed) black line indicates the position of the kinematic major (minor) axis. The cross denotes the continuum peak in all panels.
Current usage metrics show cumulative count of Article Views (full-text article views including HTML views, PDF and ePub downloads, according to the available data) and Abstracts Views on Vision4Press platform.
Data correspond to usage on the plateform after 2015. The current usage metrics is available 48-96 hours after online publication and is updated daily on week days.
Initial download of the metrics may take a while.