Fig. 2
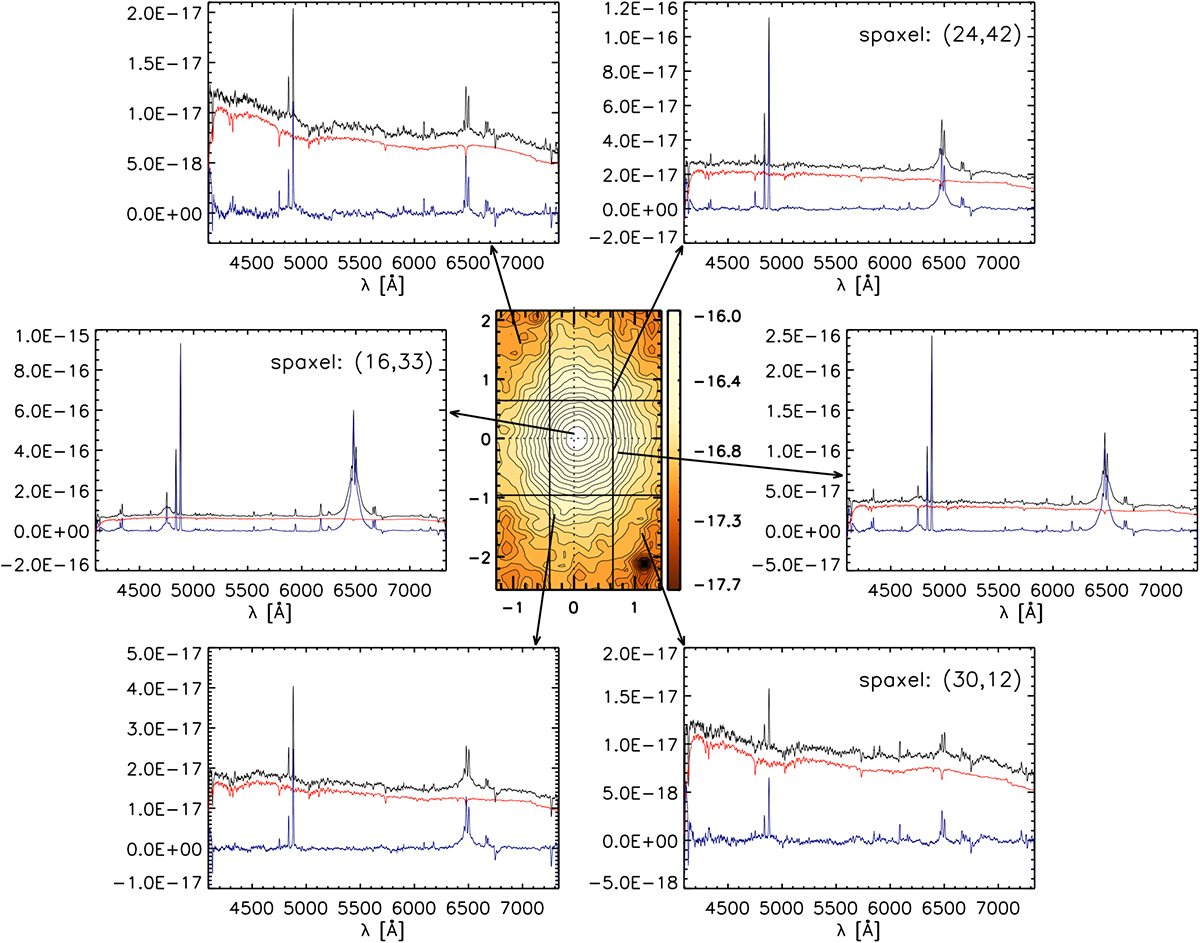
Fits of the Gemini GMOS spectra of ESO 362-G18 using the MILES Stellar Library (Sánchez-Blázquez et al. 2006) for six spaxels, indicated by the arrows on the continuum image of ESO 362-G18 (the same as Fig. 1 top right panel). The spectra (black lines) and their corresponding fits (red lines) at various locations inthe Gemini GMOS field are shown. The vertical and horizontal lines in this continuum image delimit the small apertures where spatial averages of spectra were taken to obtain the spectra most used by pPXF (whose contributions were more important for the best fit to the continuum). The vertical position of the best-fitting spectra obtained with pPXF (Cappellari & Emsellem 2004) are slightly shifted for legibility; the residual (emission line only) spectra are presented on the bottom (blue lines). Axes units of the continuum image are arcseconds and the y axes of the spectra have units of erg cm−2 s−1 Å−1.
Current usage metrics show cumulative count of Article Views (full-text article views including HTML views, PDF and ePub downloads, according to the available data) and Abstracts Views on Vision4Press platform.
Data correspond to usage on the plateform after 2015. The current usage metrics is available 48-96 hours after online publication and is updated daily on week days.
Initial download of the metrics may take a while.