Fig. 12
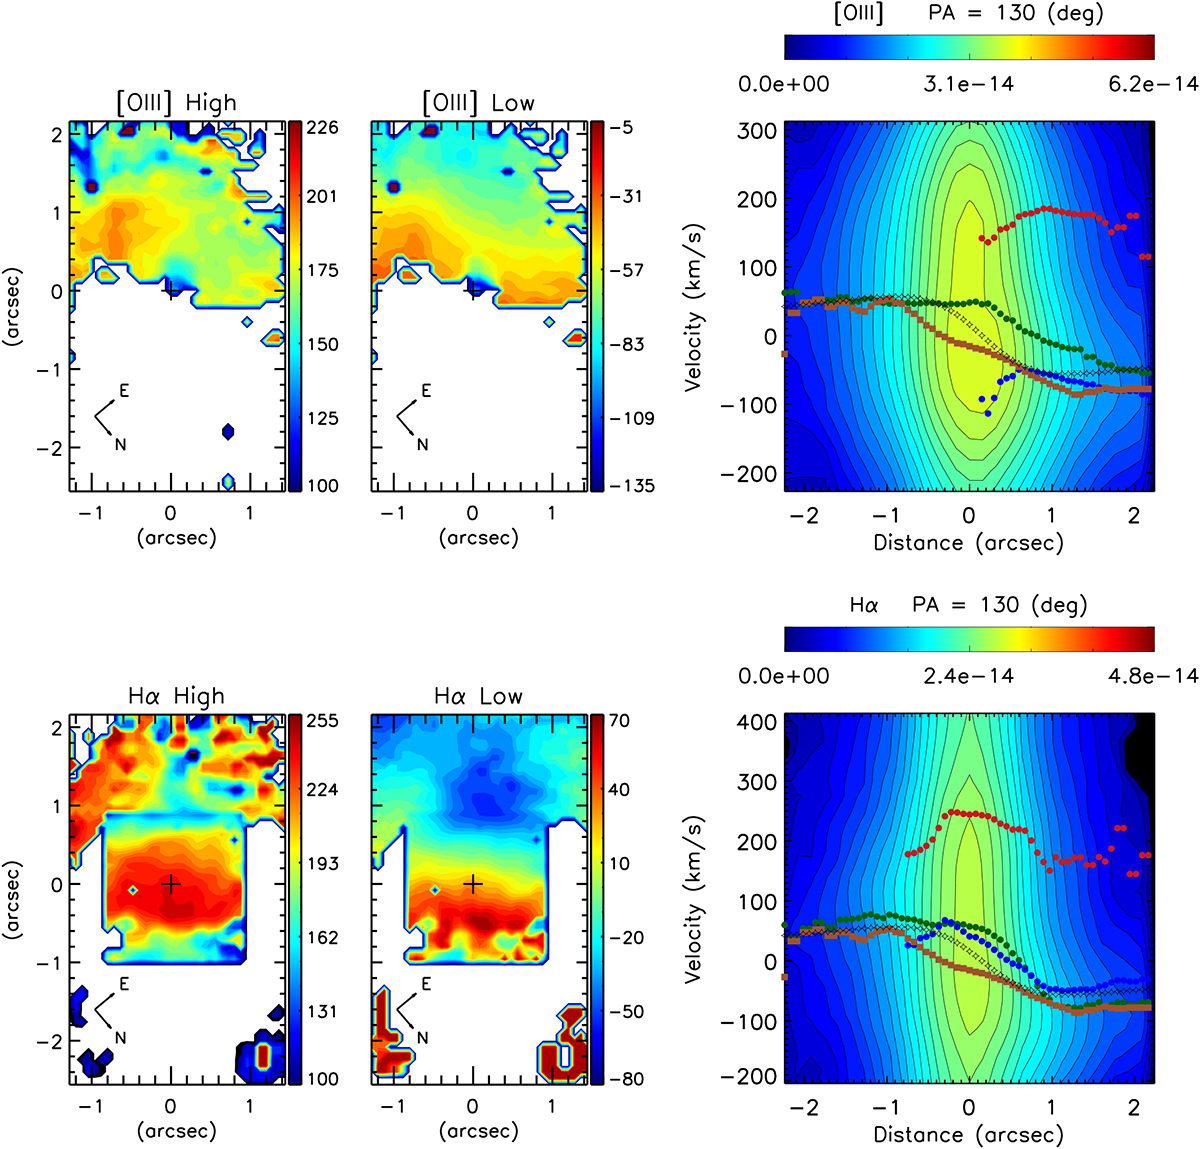
Results of the double component fit to the [O III] (top) and Hα (bottom) lines. Left and middle panels: Velocity fields of the high-velocity and low-velocity narrow components, following the colour bar to the right, are shown. White denotes regions where a single Gaussian fit is preferred (see Sect. 3.5). Rightmost panels: PV diagrams as in Fig. 10, but this time we use blue and red points to denote the velocities of the low- and high-velocity components, respectively, and green points to denote the velocities obtained from the single Gaussian fitting. For comparison, we overplot the [N II] (filled brown squares) and stellar (open black stars) velocity curves along the same PA.
Current usage metrics show cumulative count of Article Views (full-text article views including HTML views, PDF and ePub downloads, according to the available data) and Abstracts Views on Vision4Press platform.
Data correspond to usage on the plateform after 2015. The current usage metrics is available 48-96 hours after online publication and is updated daily on week days.
Initial download of the metrics may take a while.