Fig. 4
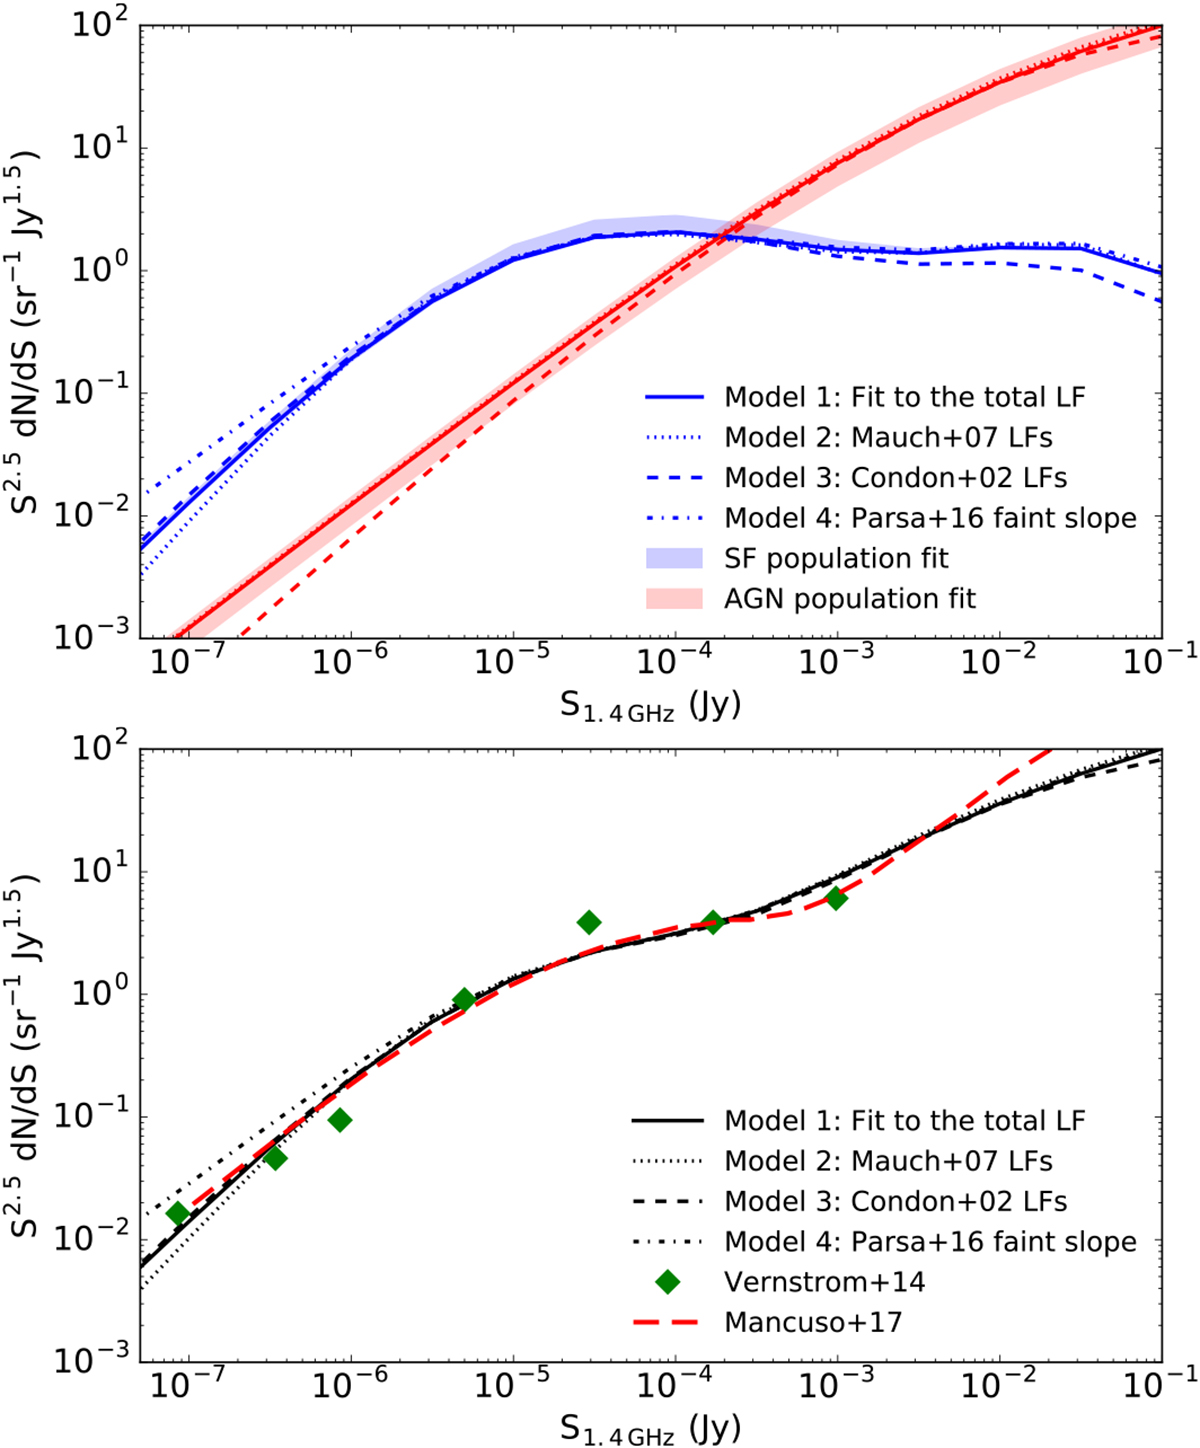
Top panel: Euclidean normalized radio source number counts obtained by fitting the total radio LF using different evolving analytical LFs with the MCMC algorithm. Red lines (AGN) have the same line styles as blue lines (SF), as indicated in the legend. The shaded areas are equivalent to those in Fig. 3. Bottom panel: total number counts for different models obtained by adding together SF and AGN contributions.
Current usage metrics show cumulative count of Article Views (full-text article views including HTML views, PDF and ePub downloads, according to the available data) and Abstracts Views on Vision4Press platform.
Data correspond to usage on the plateform after 2015. The current usage metrics is available 48-96 hours after online publication and is updated daily on week days.
Initial download of the metrics may take a while.