Free Access
Fig. 2
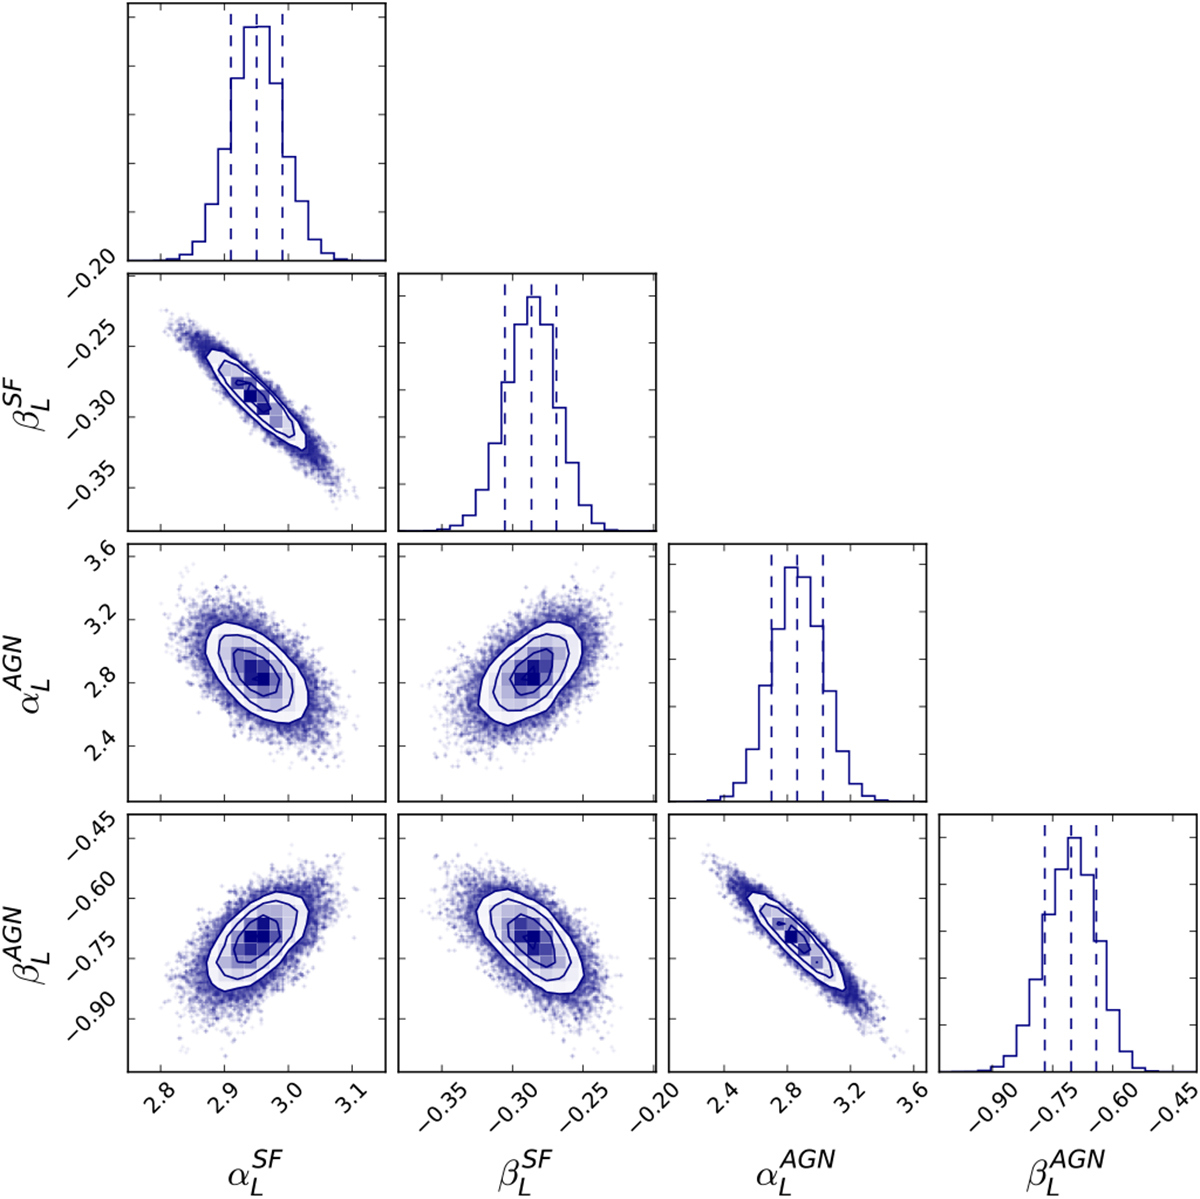
Covariance maps of four fitting parameters used to describe the total radio LF evolution. Probability distribution histograms are also shown for each parameter with 16th, 50th, and 84th percentiles marked by vertical dashed lines.
Current usage metrics show cumulative count of Article Views (full-text article views including HTML views, PDF and ePub downloads, according to the available data) and Abstracts Views on Vision4Press platform.
Data correspond to usage on the plateform after 2015. The current usage metrics is available 48-96 hours after online publication and is updated daily on week days.
Initial download of the metrics may take a while.