Fig. 1
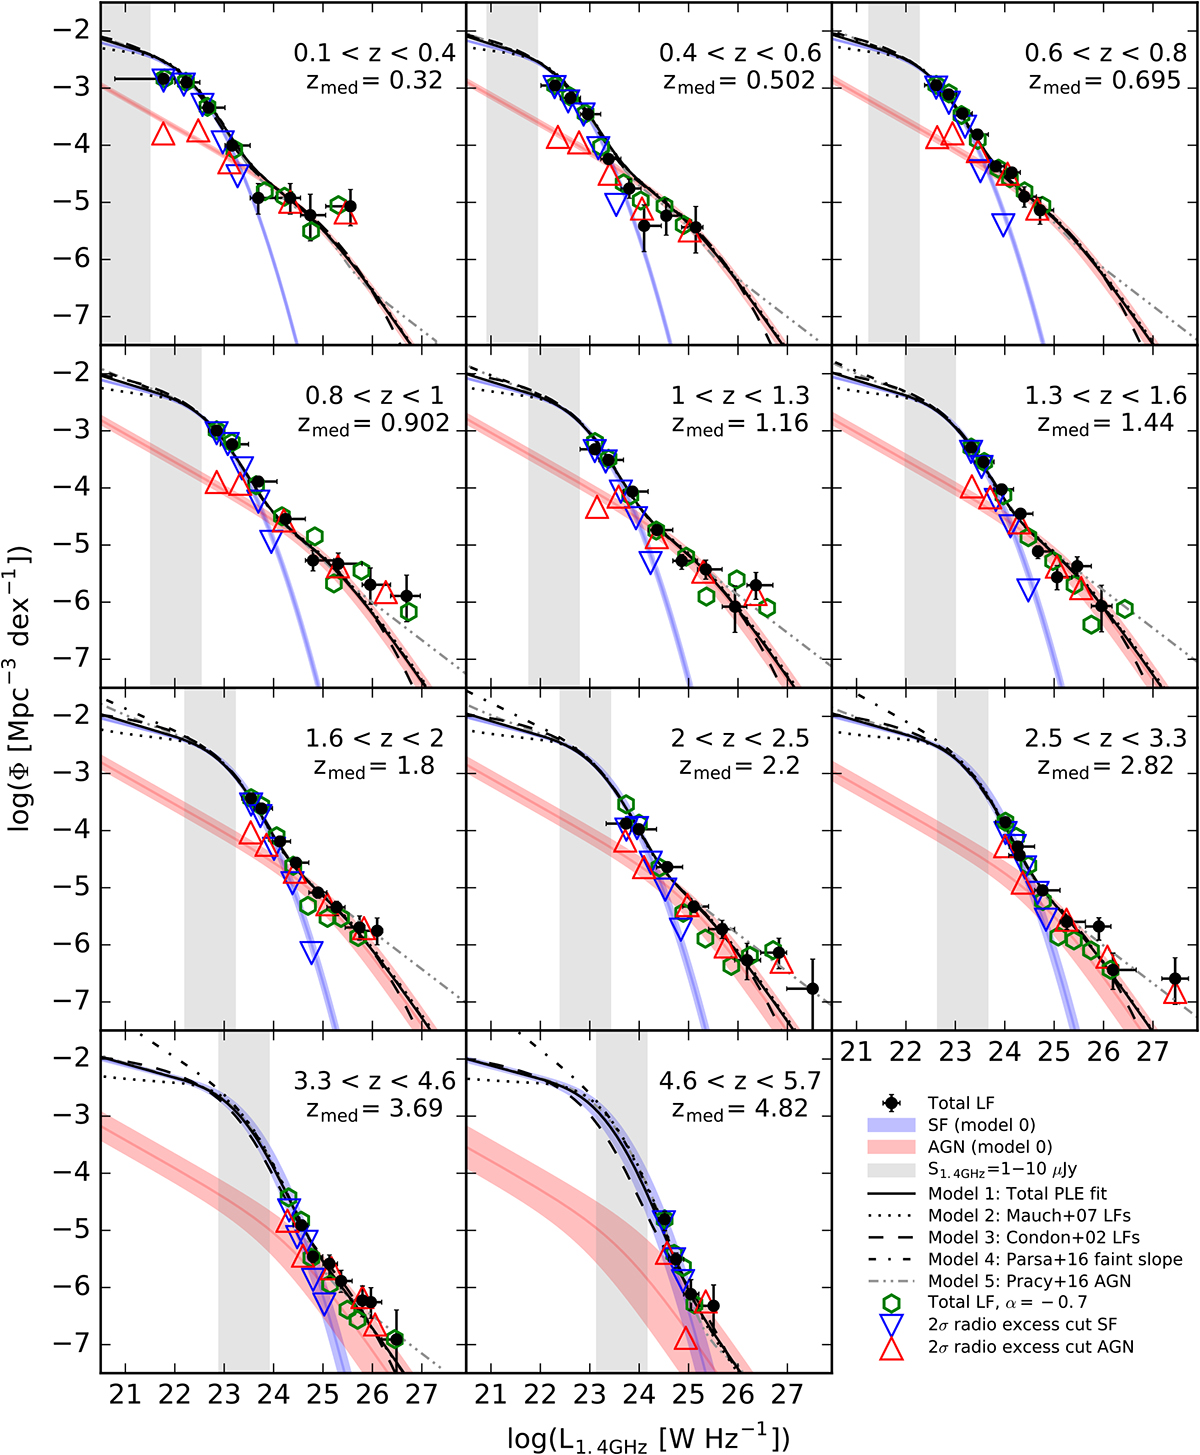
Total radio LFs at different cosmic epochs. Black points show LFs derived using the Vmax method (see Sect. 3.1). The blue and red shaded areas show the ± 3σ ranges of the best-fit evolution for the individual SF and AGN populations, respectively (outlined in Sect. 3.2). The black line is the fit to the total radio LF, as explained in Sect. 3.3. Other models used are indicated in the legend. In all of these models we assume the local (z ≈ 0) LFs from the respective papers and fit for the PLE parameters as in Eq. (5). The only exception is model 4, where the shape of the faint slope of the SF LF changes with redshift. The vertical gray shaded area shows the luminosity decade that contributes to the radio source counts between 1 and 10 μJy.
Current usage metrics show cumulative count of Article Views (full-text article views including HTML views, PDF and ePub downloads, according to the available data) and Abstracts Views on Vision4Press platform.
Data correspond to usage on the plateform after 2015. The current usage metrics is available 48-96 hours after online publication and is updated daily on week days.
Initial download of the metrics may take a while.