Open Access
Fig. 11
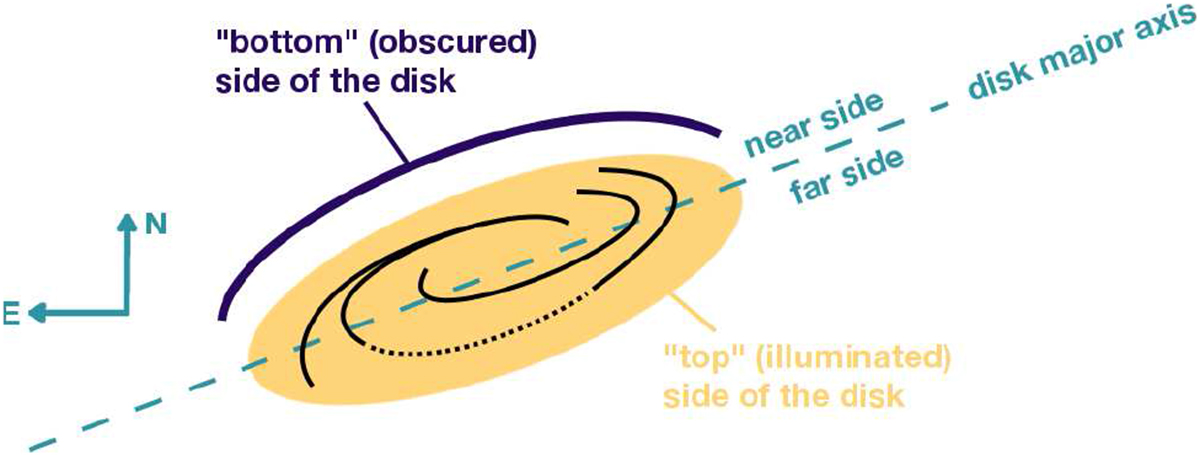
Sketch of the disk model suggested by our observations and modelling. North is up and east is towards the left. The major axis of the disk is indicated by the dashed line and divides the disk into a near and far side. The top (illuminated) and bottom (obscured) halves are separated by the disk midplane.
Current usage metrics show cumulative count of Article Views (full-text article views including HTML views, PDF and ePub downloads, according to the available data) and Abstracts Views on Vision4Press platform.
Data correspond to usage on the plateform after 2015. The current usage metrics is available 48-96 hours after online publication and is updated daily on week days.
Initial download of the metrics may take a while.