Fig. 1
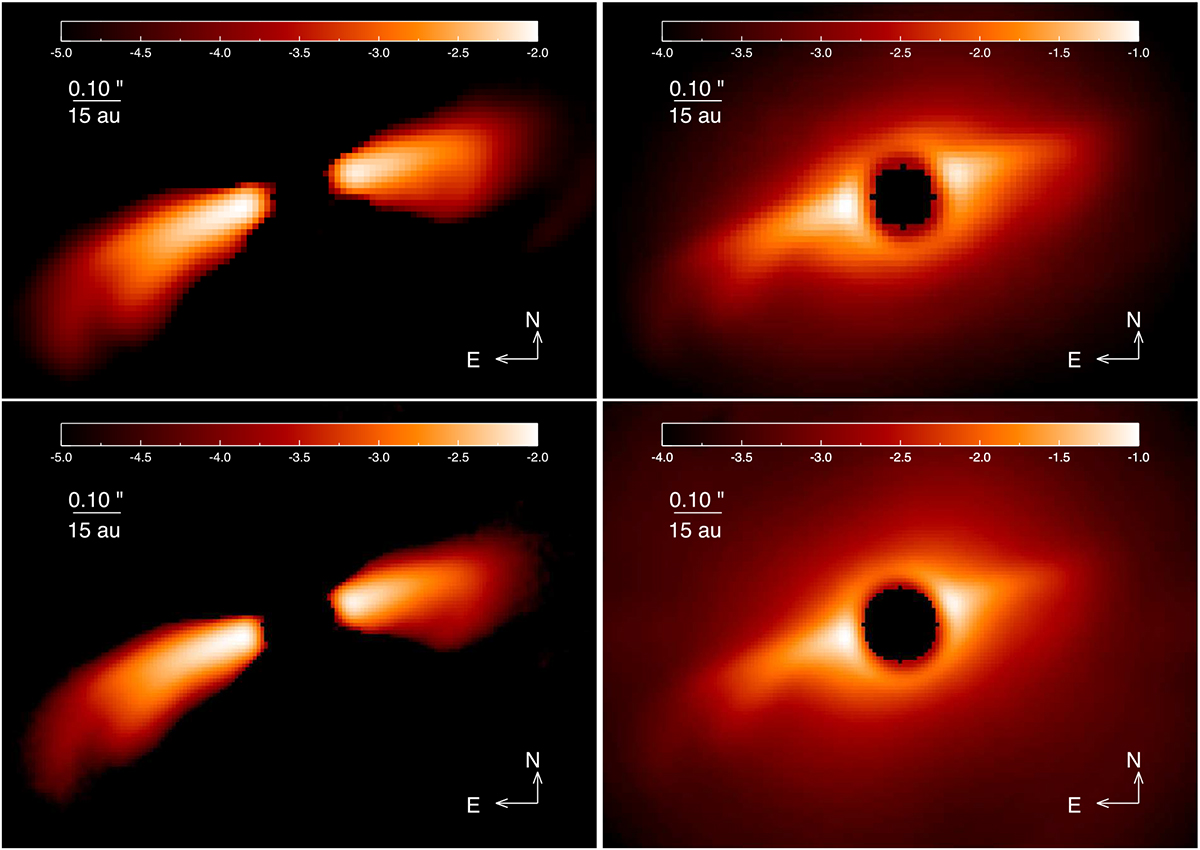
IRDIS cADI (top left) and noADI (top right) H2+H3 image normalized to the maximum of the unsaturated non-coronagraphic PSF showing the close-in environment of RY Lup. cADI (bottom left) and noADI (bottom right) IFS YJ image normalized to the maximum of the unsaturated non-coronagraphic PSF showing the close-in environment of RY Lup. The dark central region corresponds to the area masked by the coronagraph. The intensity scale is logarithmic. The orientation is standard: north is up and the east is towards the left
Current usage metrics show cumulative count of Article Views (full-text article views including HTML views, PDF and ePub downloads, according to the available data) and Abstracts Views on Vision4Press platform.
Data correspond to usage on the plateform after 2015. The current usage metrics is available 48-96 hours after online publication and is updated daily on week days.
Initial download of the metrics may take a while.