Fig. 11
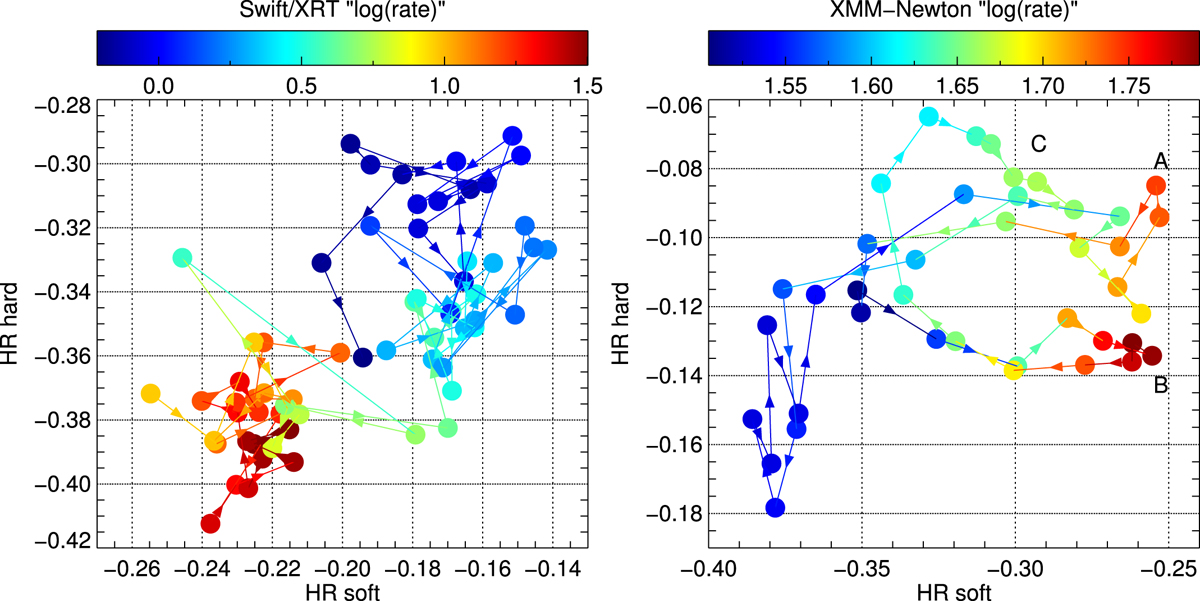
Left panel: hardness ratio evolution of the average X-ray spectrum of SMC X-3 as estimated for all Swift/XRT observations. Calculations were made using the three bands 0.5–2.0 keV, 2.0–4.5 keV, and 4.5–10.0 keV. HR soft was estimated using the two former energy bands, while HR hard was estimated for the latter two. Colors are representative of the average count rate of each observation, while arrows connect the observations in chronological order. Right panel: hardness ratio evolution of the phase-resolved X-ray spectrum of SMC X-3 based on the XMM-Newton observation. HRs were definedas in the left plot, while 40 phase bins were used. Colors are representative of the average count rate of each phase bin, while arrows connect the observations based on their phase evolution. The labels A, B, and C represent the three peaks in Fig. 1.
Current usage metrics show cumulative count of Article Views (full-text article views including HTML views, PDF and ePub downloads, according to the available data) and Abstracts Views on Vision4Press platform.
Data correspond to usage on the plateform after 2015. The current usage metrics is available 48-96 hours after online publication and is updated daily on week days.
Initial download of the metrics may take a while.