Fig. 2
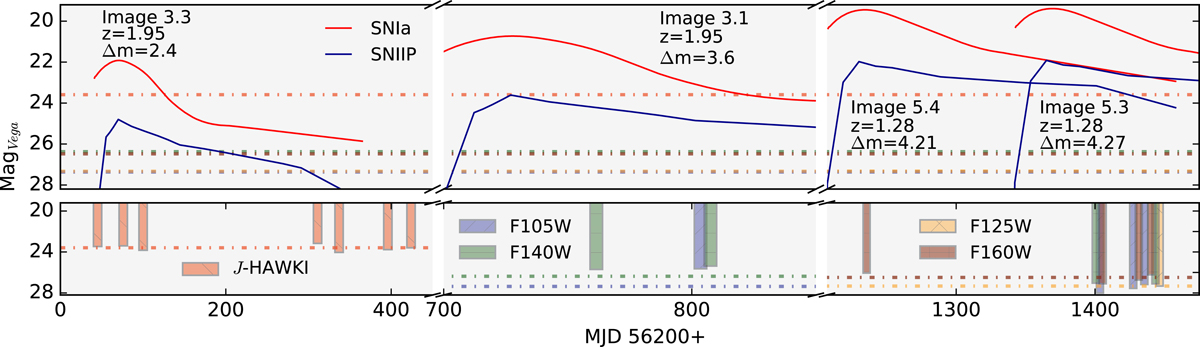
Top panels: simulated light curves of SNe Ia and IIP in F125W band for pairs of images of strongly lensed galaxies behind A370. The redshift and magnifications of the galaxy images are shown. If a SN had exploded in galaxy image 3.3, another image would have been observed in galaxy 3.1 with a time delay of ~600 days. Similarly, if it had exploded in 5.4, the SN would have reappeared in galaxy image 5.3 with a time delay of ~130 days. Bottom panels: magnitude limit for the HAWK-I in J band and HFF observations in F105W, F125W, F140W and F160W bands of A370 as presented in Tables 2 and 6. Both panels: the dotted lines indicate the median magnitude limit for the HAWK-I and HFF/WFC3 surveys.
Current usage metrics show cumulative count of Article Views (full-text article views including HTML views, PDF and ePub downloads, according to the available data) and Abstracts Views on Vision4Press platform.
Data correspond to usage on the plateform after 2015. The current usage metrics is available 48-96 hours after online publication and is updated daily on week days.
Initial download of the metrics may take a while.