Free Access
Fig. 2
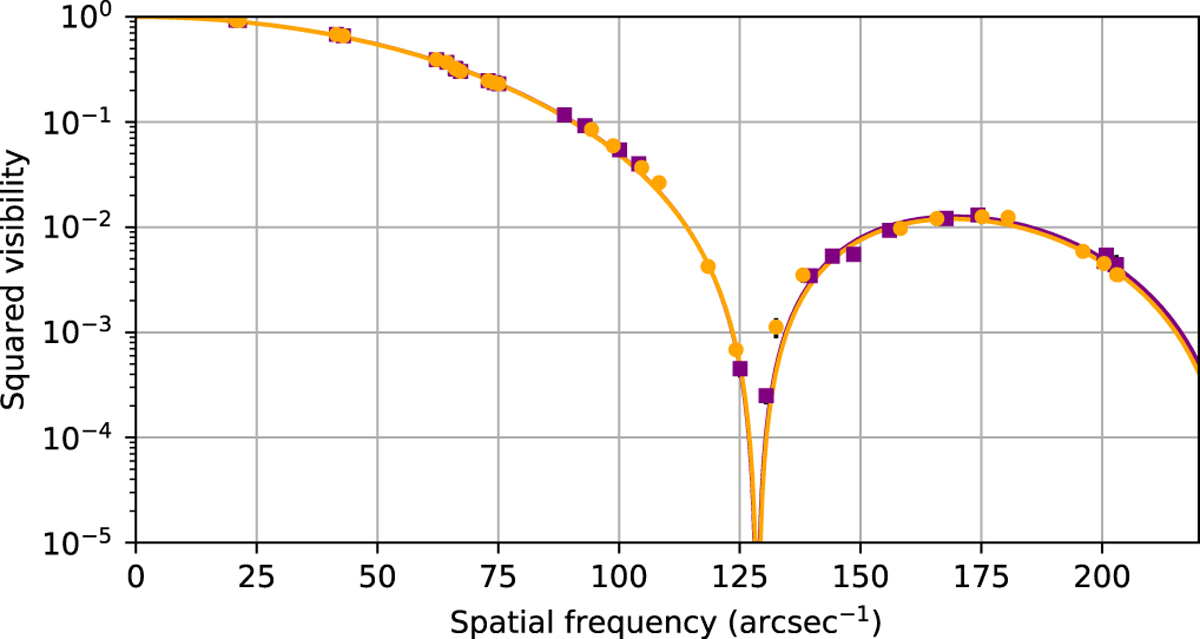
Squared visibility in the first two lobes measured by VLTI/PIONIER on CE Tau at 1.62 μm. The purple squares correspond to the November dataset. The orange dots correspond to the December dataset. The continuous curves are the best fit LDD power-law models for both epochs.
Current usage metrics show cumulative count of Article Views (full-text article views including HTML views, PDF and ePub downloads, according to the available data) and Abstracts Views on Vision4Press platform.
Data correspond to usage on the plateform after 2015. The current usage metrics is available 48-96 hours after online publication and is updated daily on week days.
Initial download of the metrics may take a while.