Fig. 5.
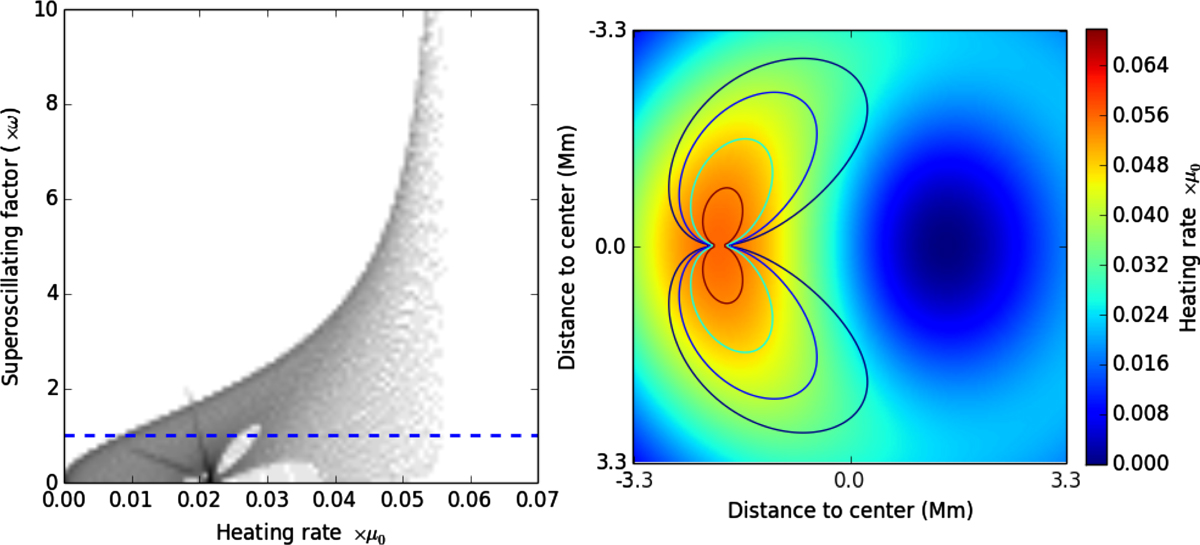
As in Fig. 4, the spatial distribution of the heating rates is shown for exactly the same conditions, but this time only the g part of the expression for the heating is shown. This g function only takes into account the superoscillatory contribution and, as expected, it is perfectly cospatial with the superoscillation contours.
Current usage metrics show cumulative count of Article Views (full-text article views including HTML views, PDF and ePub downloads, according to the available data) and Abstracts Views on Vision4Press platform.
Data correspond to usage on the plateform after 2015. The current usage metrics is available 48-96 hours after online publication and is updated daily on week days.
Initial download of the metrics may take a while.