Fig. 4.
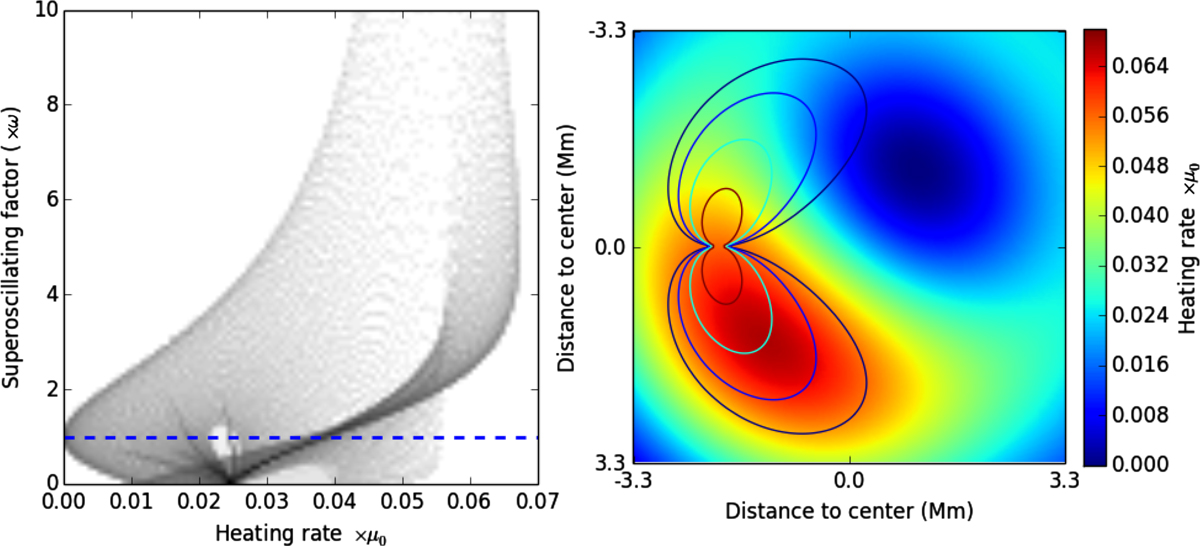
Spatial distribution of heating rates and superoscillation in the plane transverse to the propagation during the transition from sausage to kink. Left: a density plot of superoscillations versus heating rates where this latter is seen to reach a maximum for superoscillation factors of around 3. Right: a map of the transverse plane with heating rates in colour and superoscillation factors in contours (values of 2, 3, 5 and 10 times the global frequency shown). Two superoscillatory lobes appear around the position of the dislocation, but only one of them is associated with high heating rates. This asymmetry is due to the interaction between the f and g parts of the expression for the heating; see text.
Current usage metrics show cumulative count of Article Views (full-text article views including HTML views, PDF and ePub downloads, according to the available data) and Abstracts Views on Vision4Press platform.
Data correspond to usage on the plateform after 2015. The current usage metrics is available 48-96 hours after online publication and is updated daily on week days.
Initial download of the metrics may take a while.