Fig. 3.
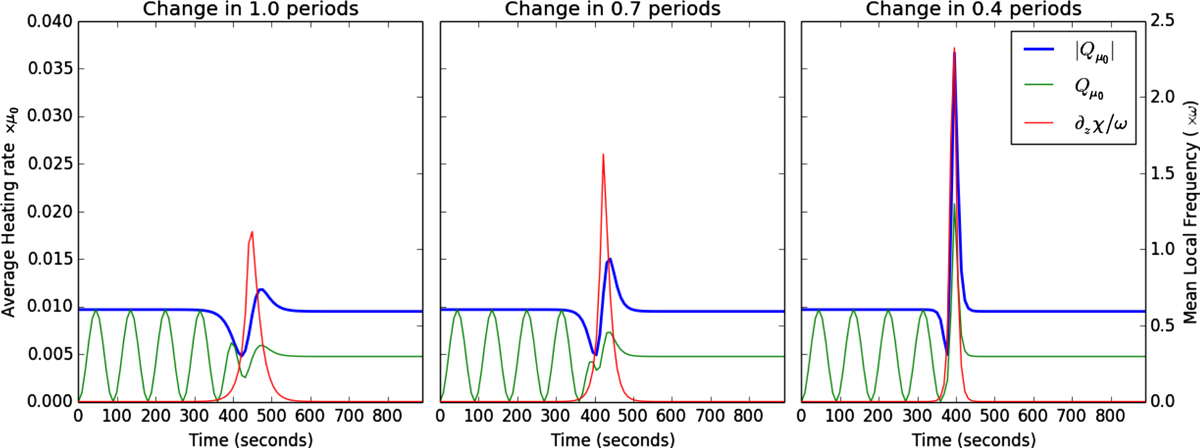
Heating integrated in a transverse plane as a function of time for three different cases in which the change from sausage to kink takes place in 1, 0.7, or 0.4 periods, respectively, from left to right. The green curve is the actual heating, which depends on the phase of the wave. The blue curve is the envelope of this heating for all possible phases; it represents the maximum heating attainable. The red curve (right axis) shows the mean superoscillation factor. The highest heating rates coincide in time with the highest superoscillation.
Current usage metrics show cumulative count of Article Views (full-text article views including HTML views, PDF and ePub downloads, according to the available data) and Abstracts Views on Vision4Press platform.
Data correspond to usage on the plateform after 2015. The current usage metrics is available 48-96 hours after online publication and is updated daily on week days.
Initial download of the metrics may take a while.