Fig. 9
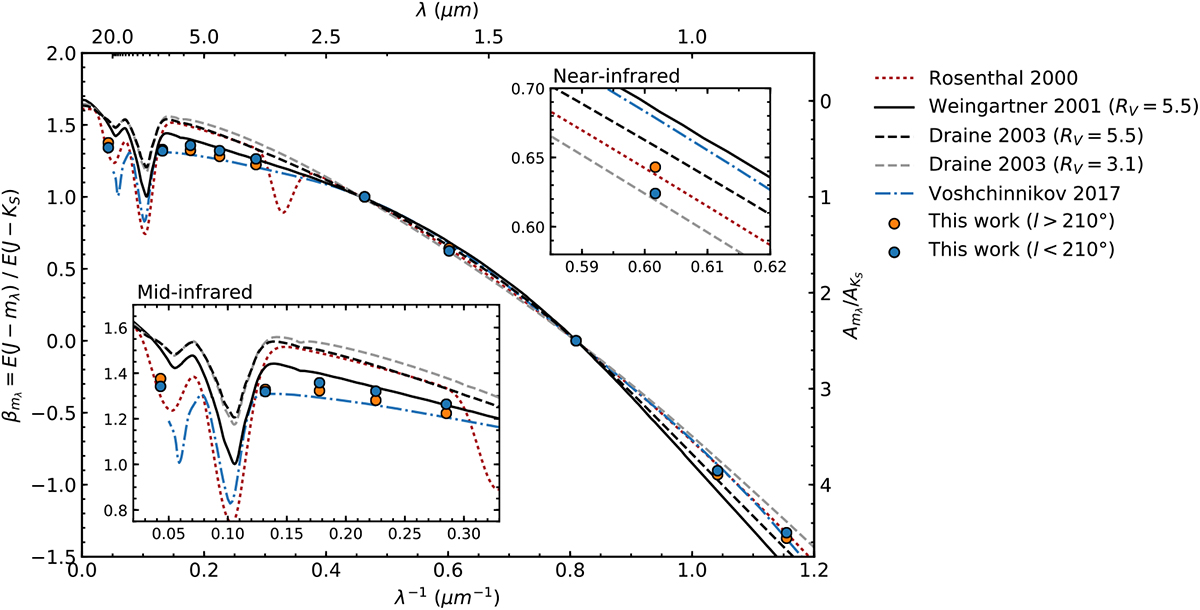
Infrared extinction curve of Orion A in terms of the colour excess ratio ![]() as used in this manuscript. The total extinction ratio
as used in this manuscript. The total extinction ratio ![]() on the right axis of the plot is the conversion of this ratio as given in Eq. (23) with values adopted from Indebetouw et al. (2005). The extinction law as predicted from models by Weingartner & Draine (2001, WD01), Draine (2003, D03), and Voshchinnikov et al. (2017, V17) is displayed with various lines. The red dotted line is the fit of Rosenthal et al. (2000) to their data for OMC-1 near the ONC (including the
~3.1 μm ice feature). The blue and orange circles show our measurements for the east-west split of the survey region.
on the right axis of the plot is the conversion of this ratio as given in Eq. (23) with values adopted from Indebetouw et al. (2005). The extinction law as predicted from models by Weingartner & Draine (2001, WD01), Draine (2003, D03), and Voshchinnikov et al. (2017, V17) is displayed with various lines. The red dotted line is the fit of Rosenthal et al. (2000) to their data for OMC-1 near the ONC (including the
~3.1 μm ice feature). The blue and orange circles show our measurements for the east-west split of the survey region.
Current usage metrics show cumulative count of Article Views (full-text article views including HTML views, PDF and ePub downloads, according to the available data) and Abstracts Views on Vision4Press platform.
Data correspond to usage on the plateform after 2015. The current usage metrics is available 48-96 hours after online publication and is updated daily on week days.
Initial download of the metrics may take a while.