Fig. 8
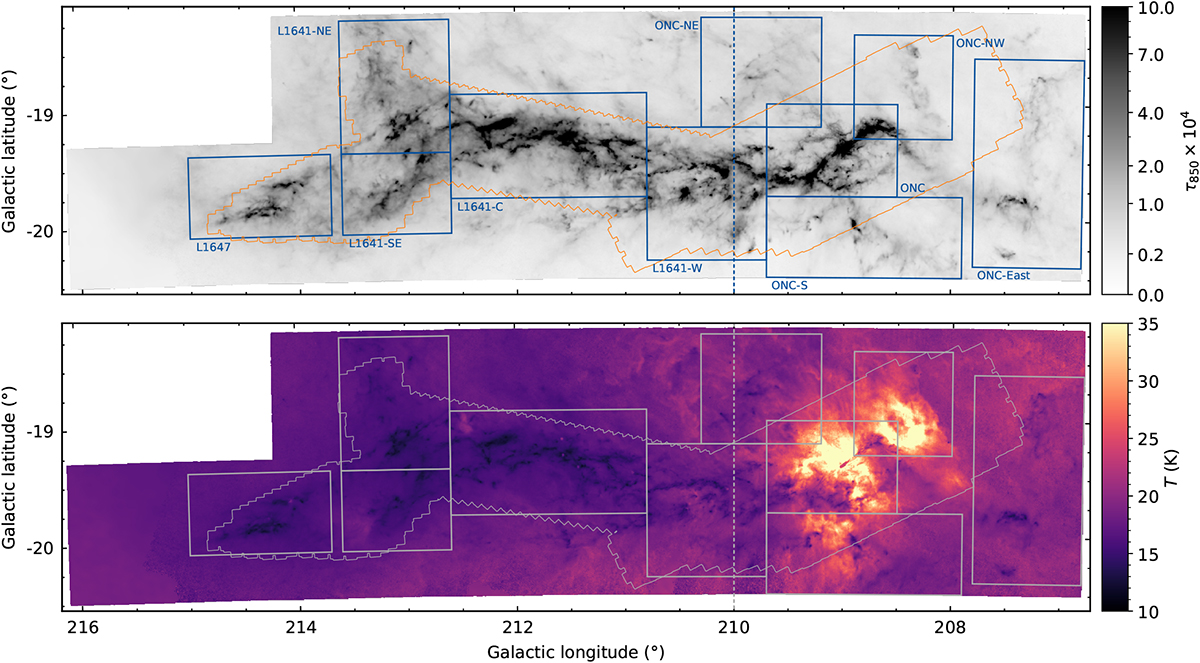
Our sub-region layout to study variations in the colour excess ratio. The top panel shows a dust optical depth map, the bottom panel the dust temperature derived by fitting a modified black-body to Herschel and Planck far-infrared data (Lombardi et al. 2014a,b). The analysis for the sub-regions is split into two parts: First, we study variations of the colour excess ratio by splitting the cloud in east-west direction at l = 210° (dashed line). Subsequently, the entire cloud is split into multiple sub-regions, outlined here by the boxes drawn with solid lines. Regions are labelled only in the top panel and the Spitzer survey contours for I1 and I2 are also drawn. toggle labels.
Current usage metrics show cumulative count of Article Views (full-text article views including HTML views, PDF and ePub downloads, according to the available data) and Abstracts Views on Vision4Press platform.
Data correspond to usage on the plateform after 2015. The current usage metrics is available 48-96 hours after online publication and is updated daily on week days.
Initial download of the metrics may take a while.