Free Access
Fig. 7
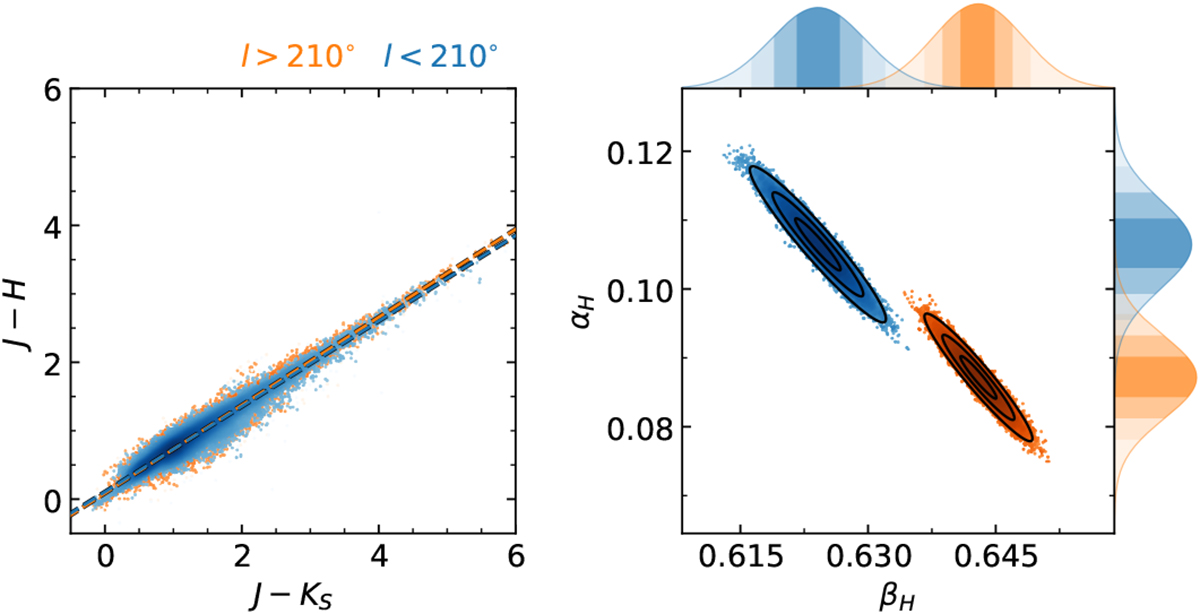
Similar to Fig. 6, we here show the fitting results for H when splitting the survey region in east-west direction along l = 210°. Our MCMC fitting method determines a significant difference in the colour excess ratios for the two sub-regions, indicating a variable extinction law across the molecular cloud.
Current usage metrics show cumulative count of Article Views (full-text article views including HTML views, PDF and ePub downloads, according to the available data) and Abstracts Views on Vision4Press platform.
Data correspond to usage on the plateform after 2015. The current usage metrics is available 48-96 hours after online publication and is updated daily on week days.
Initial download of the metrics may take a while.