Fig. 6
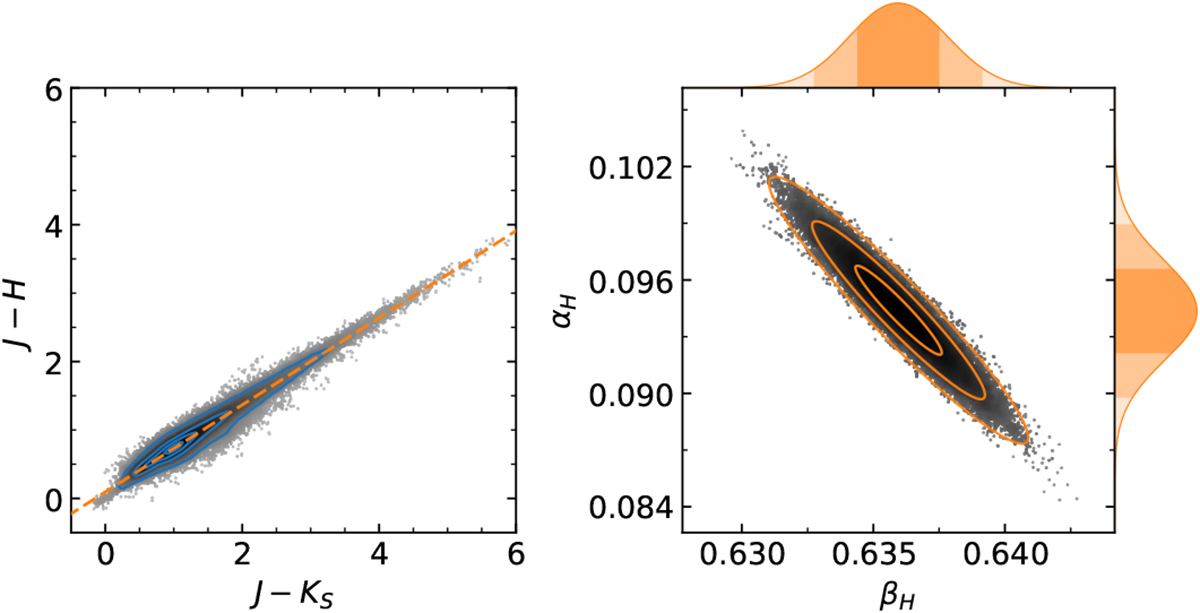
Fitting results for the colour excess ratio in H band. Left-hand side panels: filtered source distribution in a greyscale scatter plot, where the greyscale is proportional to the number density in this parameter space. The thin blue contours refer to 0.5, 10, 40, and 80% of the maximum source density. Also plotted is the resulting fit as the orange dashed line. Right-hand side panels: posterior probability distribution for the intercept αH and the slope βH (the colour excess ratio). The ellipses are the 1-, 2-, and 3-sigma covariances of the distribution. Projected to the top and to the right are normalized kernel densities of the resulting distribution for each parameter. The differently shaded filled areas under the curve highlight the 1-, 2-, and 3-σ ranges.
Current usage metrics show cumulative count of Article Views (full-text article views including HTML views, PDF and ePub downloads, according to the available data) and Abstracts Views on Vision4Press platform.
Data correspond to usage on the plateform after 2015. The current usage metrics is available 48-96 hours after online publication and is updated daily on week days.
Initial download of the metrics may take a while.