Fig. 4
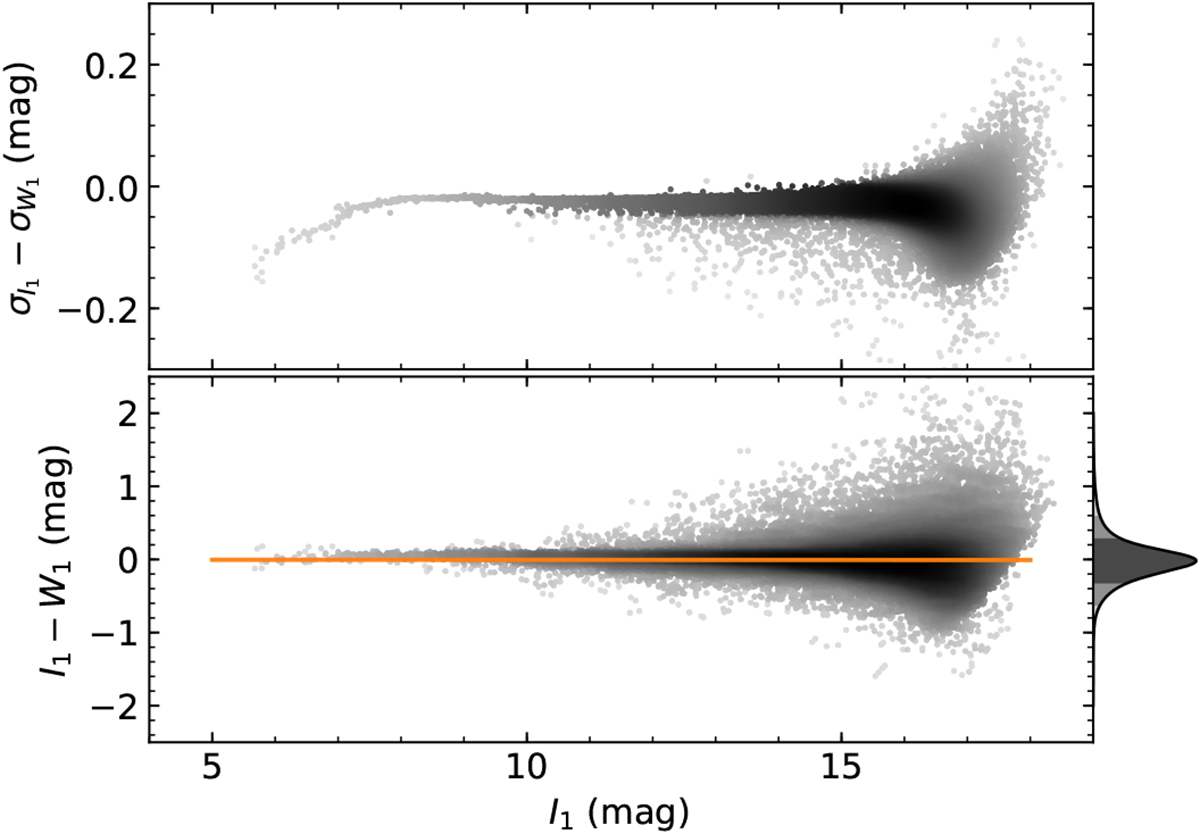
Correlation between W1 and I1. The top panel shows the difference in photometric errors, while at the bottom the difference in source magnitudes is displayed. The orange line is our linear transformation between the two systems, which maps the two bands in almost a 1:1 relation. Similar to Fig. 3, the histogram to the right represents the kernel density of the magnitude differences.
Current usage metrics show cumulative count of Article Views (full-text article views including HTML views, PDF and ePub downloads, according to the available data) and Abstracts Views on Vision4Press platform.
Data correspond to usage on the plateform after 2015. The current usage metrics is available 48-96 hours after online publication and is updated daily on week days.
Initial download of the metrics may take a while.