Fig. 3
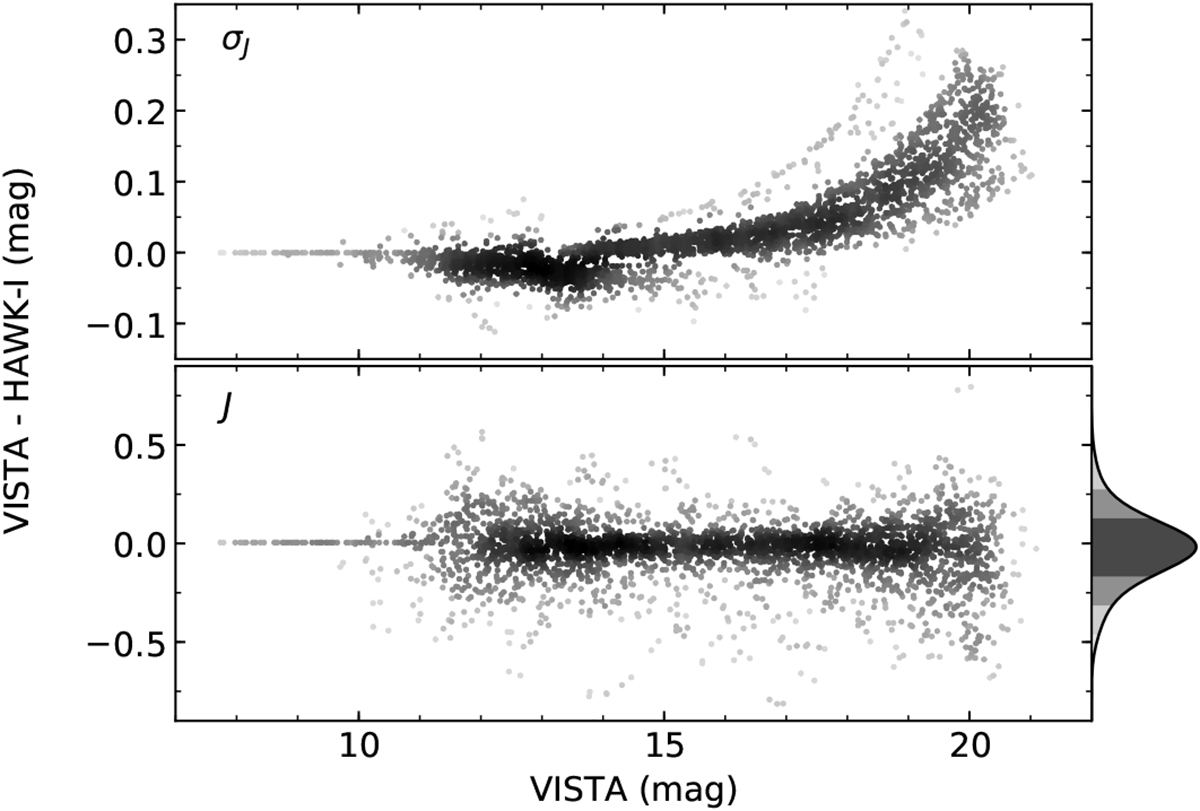
Comparison of VISTA and HAWK-I photometry in J band. The panel at the top shows the difference in photometric errors as a function of the apparent VISTA magnitude. Similarly, the bottom plot displays the difference in the measured source magnitudes. The histogram to the right shows the distribution of the magnitude difference as a kernel density. Assuming a Gaussian distribution, the differently shaded areas under the curve represent the 1, 2, and 3-σ limits.
Current usage metrics show cumulative count of Article Views (full-text article views including HTML views, PDF and ePub downloads, according to the available data) and Abstracts Views on Vision4Press platform.
Data correspond to usage on the plateform after 2015. The current usage metrics is available 48-96 hours after online publication and is updated daily on week days.
Initial download of the metrics may take a while.