Fig. 2
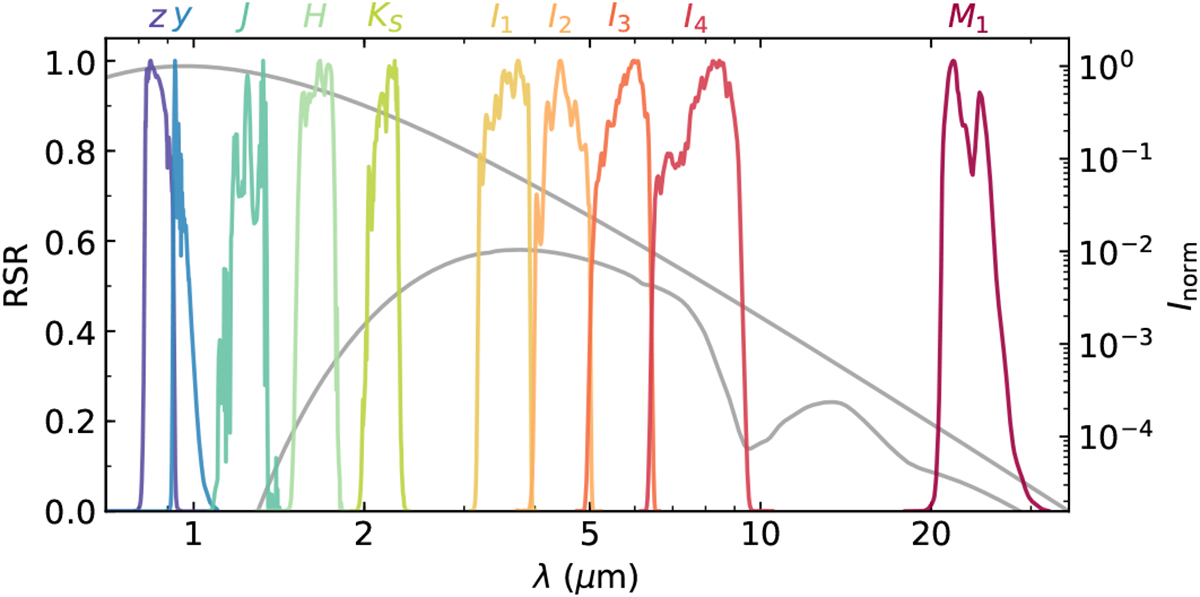
Passbands used in our analysis cover the infrared wavelength range from just below 1 μm to about 25 μm utilizing the Pan-STARRS (z, y), VISTA (J, H, KS; calibrated against 2MASS), and Spitzer (I1, I2, I3, I4, M1) photometric systems. The filter curves have each been normalized to their maximum transmission and their relative spectral response (RSR) is shown as a function of wavelength. The two solid grey lines are 3000 K black bodies with a normalized intensity (Inorm). Here, the upper line is the unmodified black body, whereas the line at the bottom shows the resulting spectral energy distribution with 5 mag extinction in the KS band and using the RV = 3.1 Draine (2003) extinction law.
Current usage metrics show cumulative count of Article Views (full-text article views including HTML views, PDF and ePub downloads, according to the available data) and Abstracts Views on Vision4Press platform.
Data correspond to usage on the plateform after 2015. The current usage metrics is available 48-96 hours after online publication and is updated daily on week days.
Initial download of the metrics may take a while.