Fig. 16
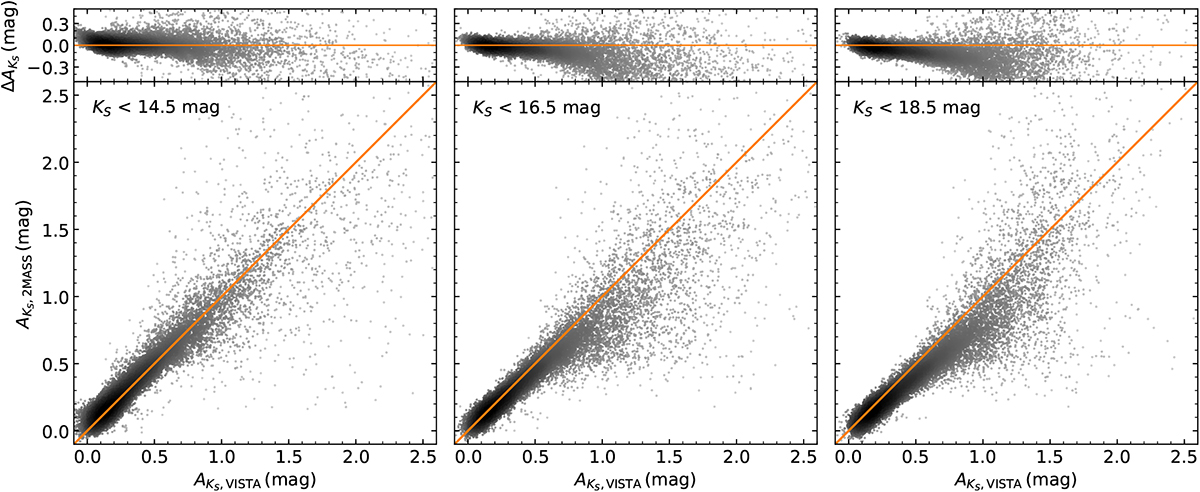
Comparison of the pixel values for extinction maps created with 2MASS and VISTA data (sensitivity limits: ~14.5 mag and ~19 mag, respectively). Each of the three panel groups shows a different magnitude limit. The leftmost plot shows a comparison for extinction maps where all source brighter than 14.5 mag in KS are used. The panel in the centre and to the right display the same comparison, but with sources brighter than 16.5 and 18.5 mag in KS, respectively. While the bottom figures directly compare the two measures, we plot their difference (![]() ) at the top of each group. The orange lines represent 1:1 correlations between the parameters.
) at the top of each group. The orange lines represent 1:1 correlations between the parameters.
Current usage metrics show cumulative count of Article Views (full-text article views including HTML views, PDF and ePub downloads, according to the available data) and Abstracts Views on Vision4Press platform.
Data correspond to usage on the plateform after 2015. The current usage metrics is available 48-96 hours after online publication and is updated daily on week days.
Initial download of the metrics may take a while.