Fig. 15
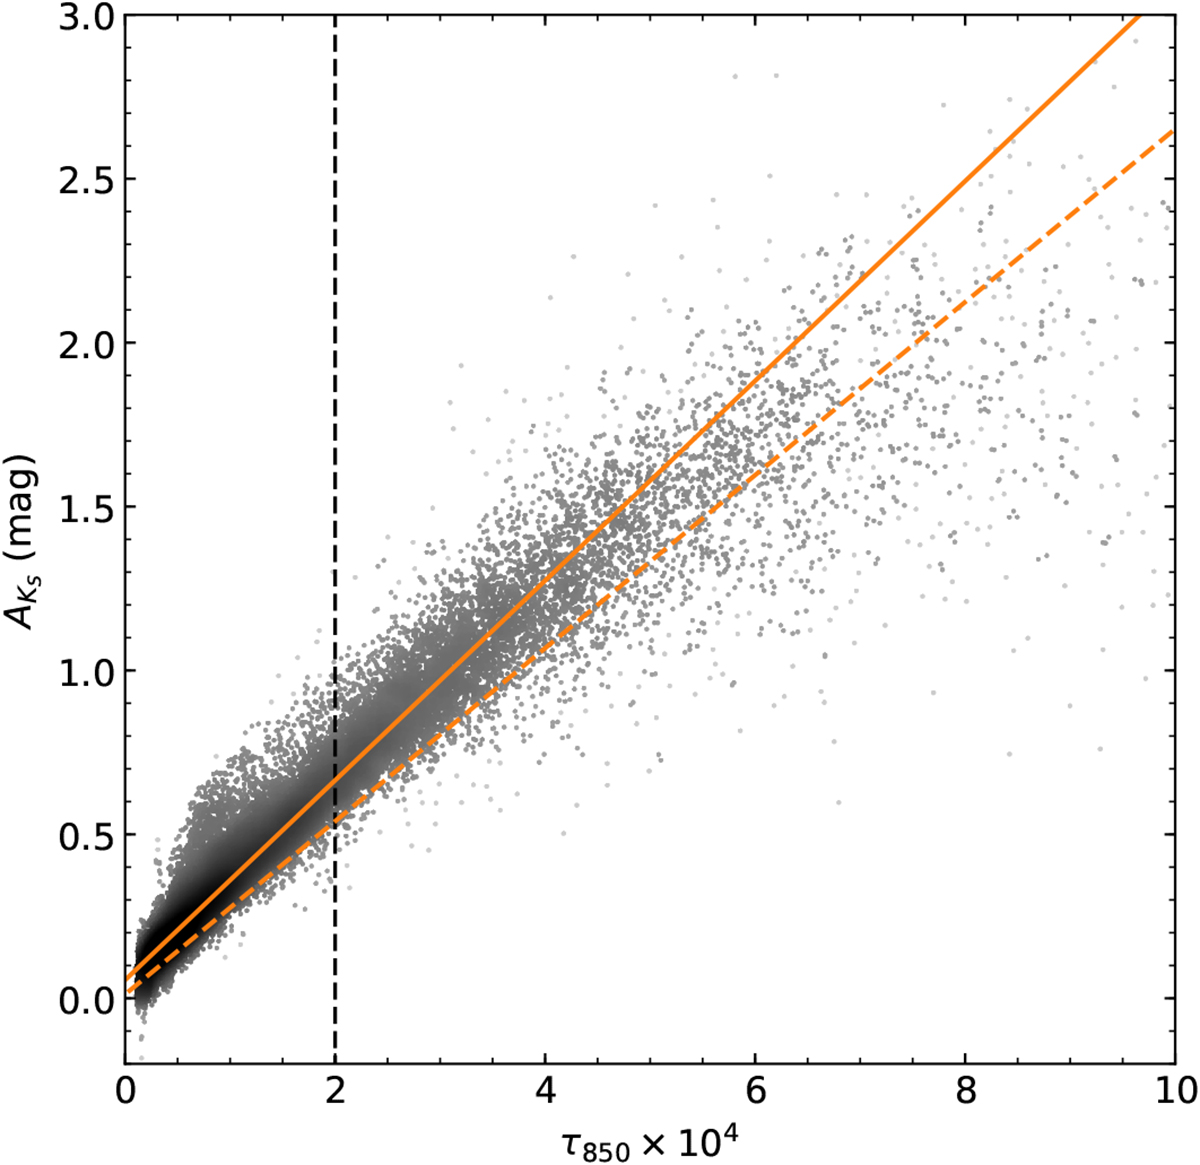
Relation between Herschel–Planck dust optical depth at 850 μm (τ850) and dust extinction in KS. The orange solid line is our linear fit with the slope γ = 3042 mag. The dashed orange line is the previous fit of Lombardi et al. (2014b, γ = 2640 mag) who used an extinction map based on 2MASS data. They also limited their fit to τ850 < 2 × 10⁴, as indicated by the vertical dashed line, while we use the entire range displayed in this figure. We find a ~ 15% larger slope in the relation due to much better sampling of the cloud’s substructure.
Current usage metrics show cumulative count of Article Views (full-text article views including HTML views, PDF and ePub downloads, according to the available data) and Abstracts Views on Vision4Press platform.
Data correspond to usage on the plateform after 2015. The current usage metrics is available 48-96 hours after online publication and is updated daily on week days.
Initial download of the metrics may take a while.