Fig. 13
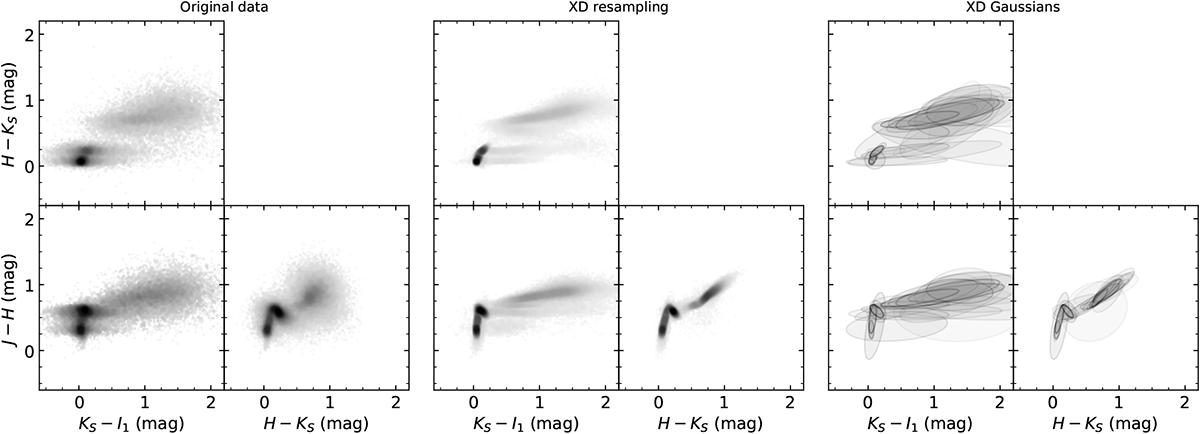
Extreme deconvolution (XD) resampling process of the three-dimensional control field data space (J − H, H − KS, KS − I1). Leftmost set of panels: original data distribution as projected views. The three panels in thecentre show the same set of combinations for the resampled data with 105 randomly drawn sources. Rightmost panels: locations of the individual three-dimensional Gaussians. For these, the opacity of the ellipses is an indicator of their respective weight in the model.
Current usage metrics show cumulative count of Article Views (full-text article views including HTML views, PDF and ePub downloads, according to the available data) and Abstracts Views on Vision4Press platform.
Data correspond to usage on the plateform after 2015. The current usage metrics is available 48-96 hours after online publication and is updated daily on week days.
Initial download of the metrics may take a while.