Fig. 12
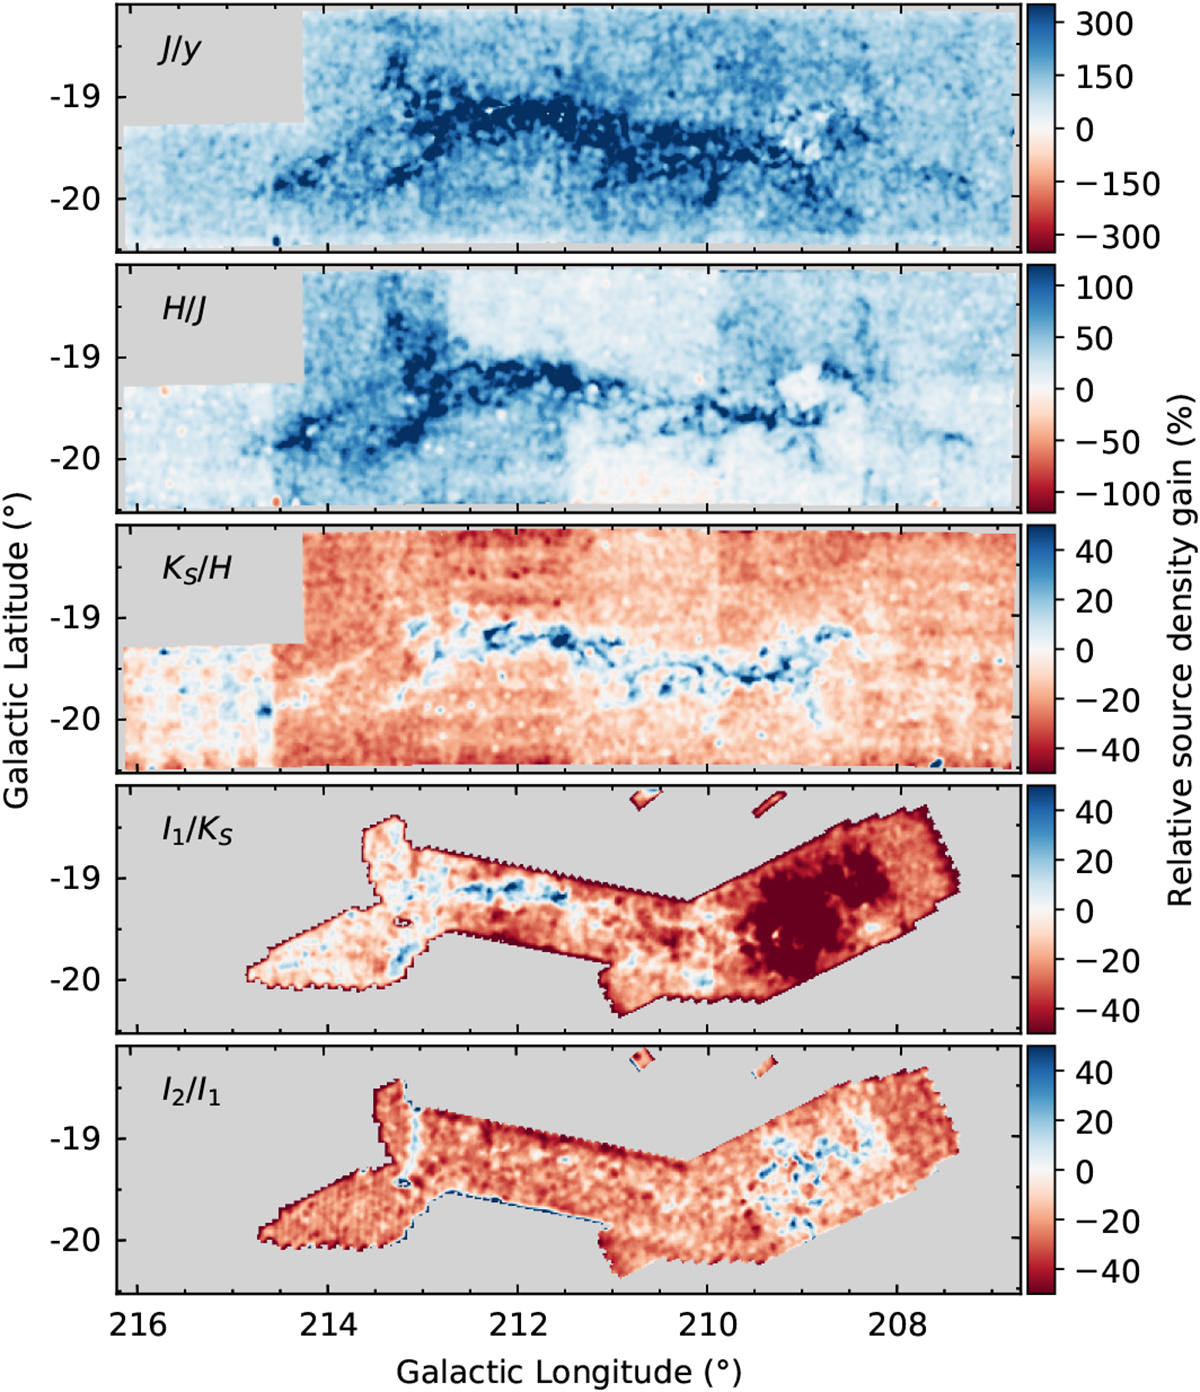
Comparison of source densities for consecutive passbands. The individual panels show the ratio of source densities for two particular passbands (e.g. J and y in the topmost panel) evaluated with a 1′ Epanechnikov kernel. The colour scale indicates the gain (or loss) of the redder band over the bluer. Clearly, the JHKS VISTA observations show overall the best sampling of sources in the region and even redder bands include more extincted sources in the cloud. Due to the small difference in the extinction between I1 and I2, the source density gain is negligible for I2. The apparent large-scale pattern for the second and third panel from the top is caused by the variable completeness of the VISTA observations.
Current usage metrics show cumulative count of Article Views (full-text article views including HTML views, PDF and ePub downloads, according to the available data) and Abstracts Views on Vision4Press platform.
Data correspond to usage on the plateform after 2015. The current usage metrics is available 48-96 hours after online publication and is updated daily on week days.
Initial download of the metrics may take a while.