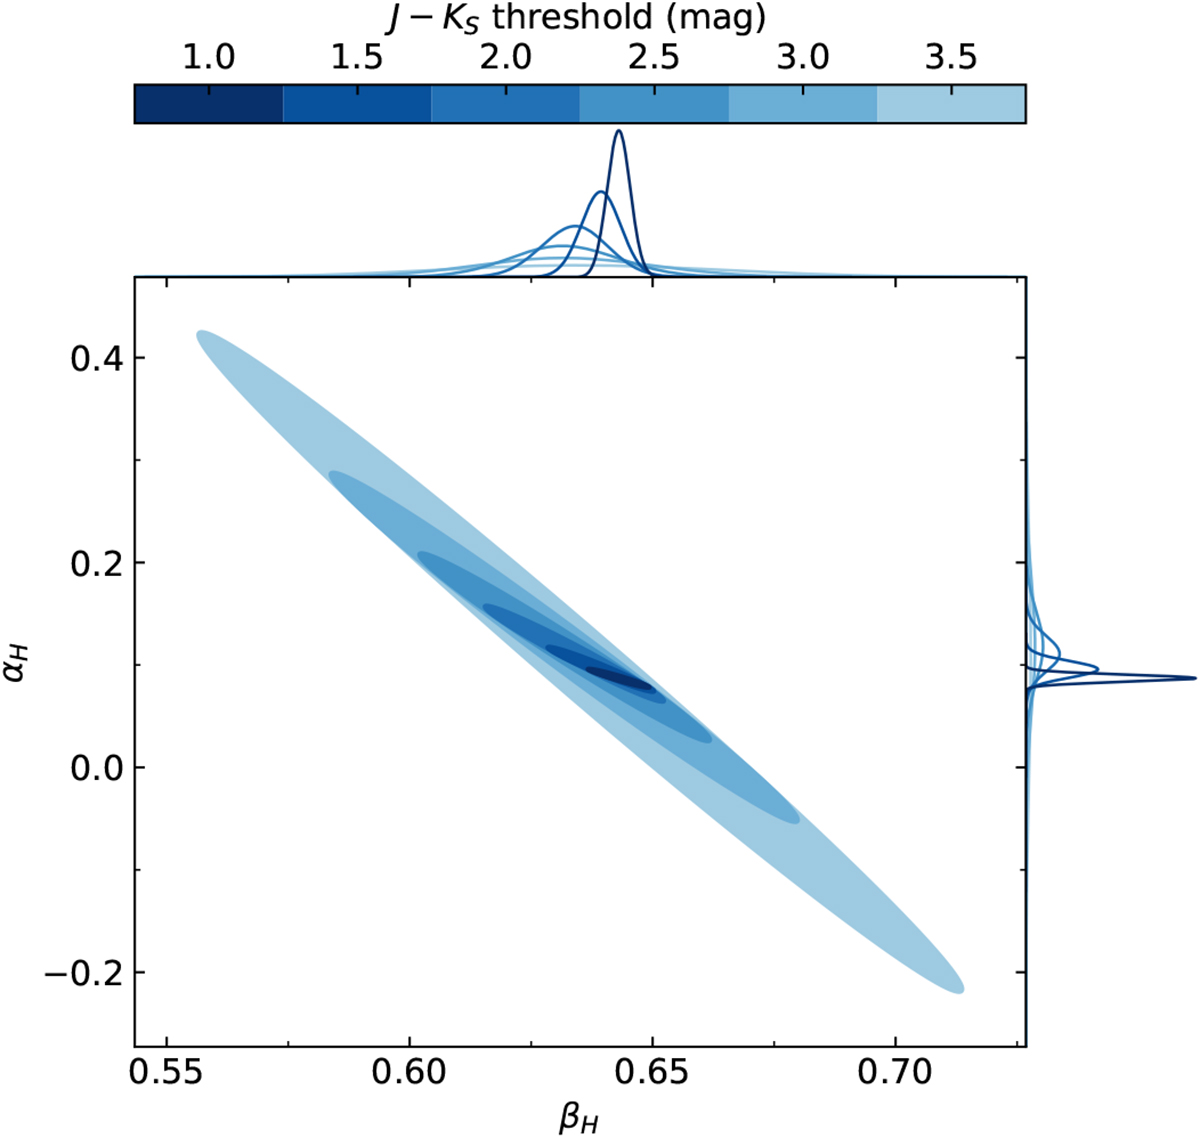
Fig. 11

Posterior probability distributions for the colours excess ratio βH and the intercept of the linear fit in the L1641/L1647 region (l > 210°) when restricting the sample to various J − KS colour thresholds. For example, for the J − KS = 1 mag threshold only source above this limit are fitted. The different thresholds are shown in increasingly dark blue colours and, similar to Fig. 6, the ellipses represent 3-sigma covariances of the parameter distribution. The histograms represent kernel densities for each parameter of the fit.
Current usage metrics show cumulative count of Article Views (full-text article views including HTML views, PDF and ePub downloads, according to the available data) and Abstracts Views on Vision4Press platform.
Data correspond to usage on the plateform after 2015. The current usage metrics is available 48-96 hours after online publication and is updated daily on week days.
Initial download of the metrics may take a while.


