Fig. 10
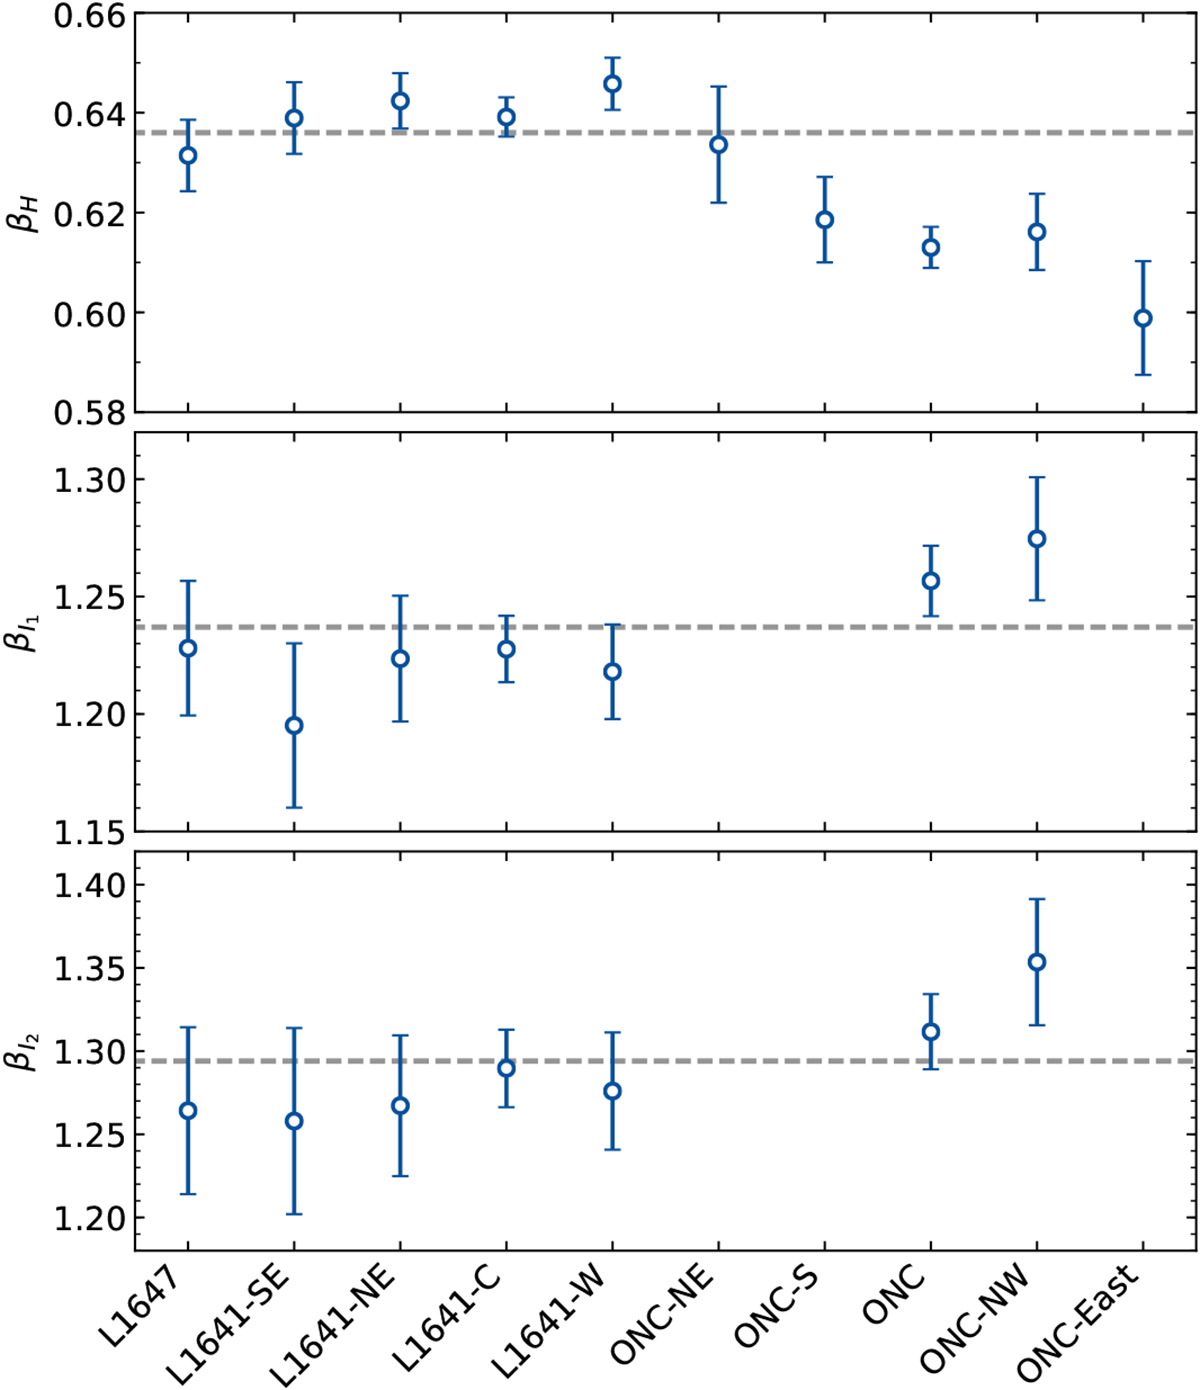
Colour excess ratios ![]() in H, I1, and I2 for the sub-regions of Orion A as defined in Fig. 8. From left to right, overall the galactic longitude of the regions decreases. The dashed horizontal lines represent the averages across the entire cloud. The slopes for L1641/ L1647 are systematically larger than the average in H (smaller for I1 and I2), while for regions near the ONC, we observe the opposite behaviour.
in H, I1, and I2 for the sub-regions of Orion A as defined in Fig. 8. From left to right, overall the galactic longitude of the regions decreases. The dashed horizontal lines represent the averages across the entire cloud. The slopes for L1641/ L1647 are systematically larger than the average in H (smaller for I1 and I2), while for regions near the ONC, we observe the opposite behaviour.
Current usage metrics show cumulative count of Article Views (full-text article views including HTML views, PDF and ePub downloads, according to the available data) and Abstracts Views on Vision4Press platform.
Data correspond to usage on the plateform after 2015. The current usage metrics is available 48-96 hours after online publication and is updated daily on week days.
Initial download of the metrics may take a while.