Fig. 1
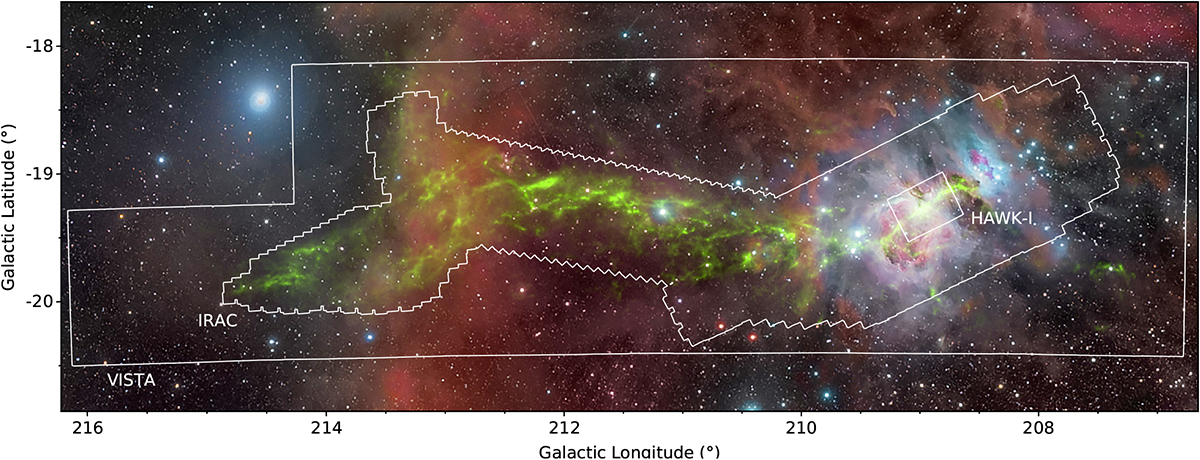
Region under investigation in this work: the Orion A molecular cloud is visualized in green with the dust optical depth map from Lombardi et al. (2014b) blended with optical image data (deepskycolors.com; © Roberto Bernal Andreo). The solid lines indicate the coverage of the various surveys used to investigate the properties of dust extinction in the cloud, where the IRAC contour outlines the region covered by either of the first two IRAC channels. We also make use of MIPSdata, for which the covered region generally encompasses the IRAC contour. toggle labels
Current usage metrics show cumulative count of Article Views (full-text article views including HTML views, PDF and ePub downloads, according to the available data) and Abstracts Views on Vision4Press platform.
Data correspond to usage on the plateform after 2015. The current usage metrics is available 48-96 hours after online publication and is updated daily on week days.
Initial download of the metrics may take a while.