Fig. 4
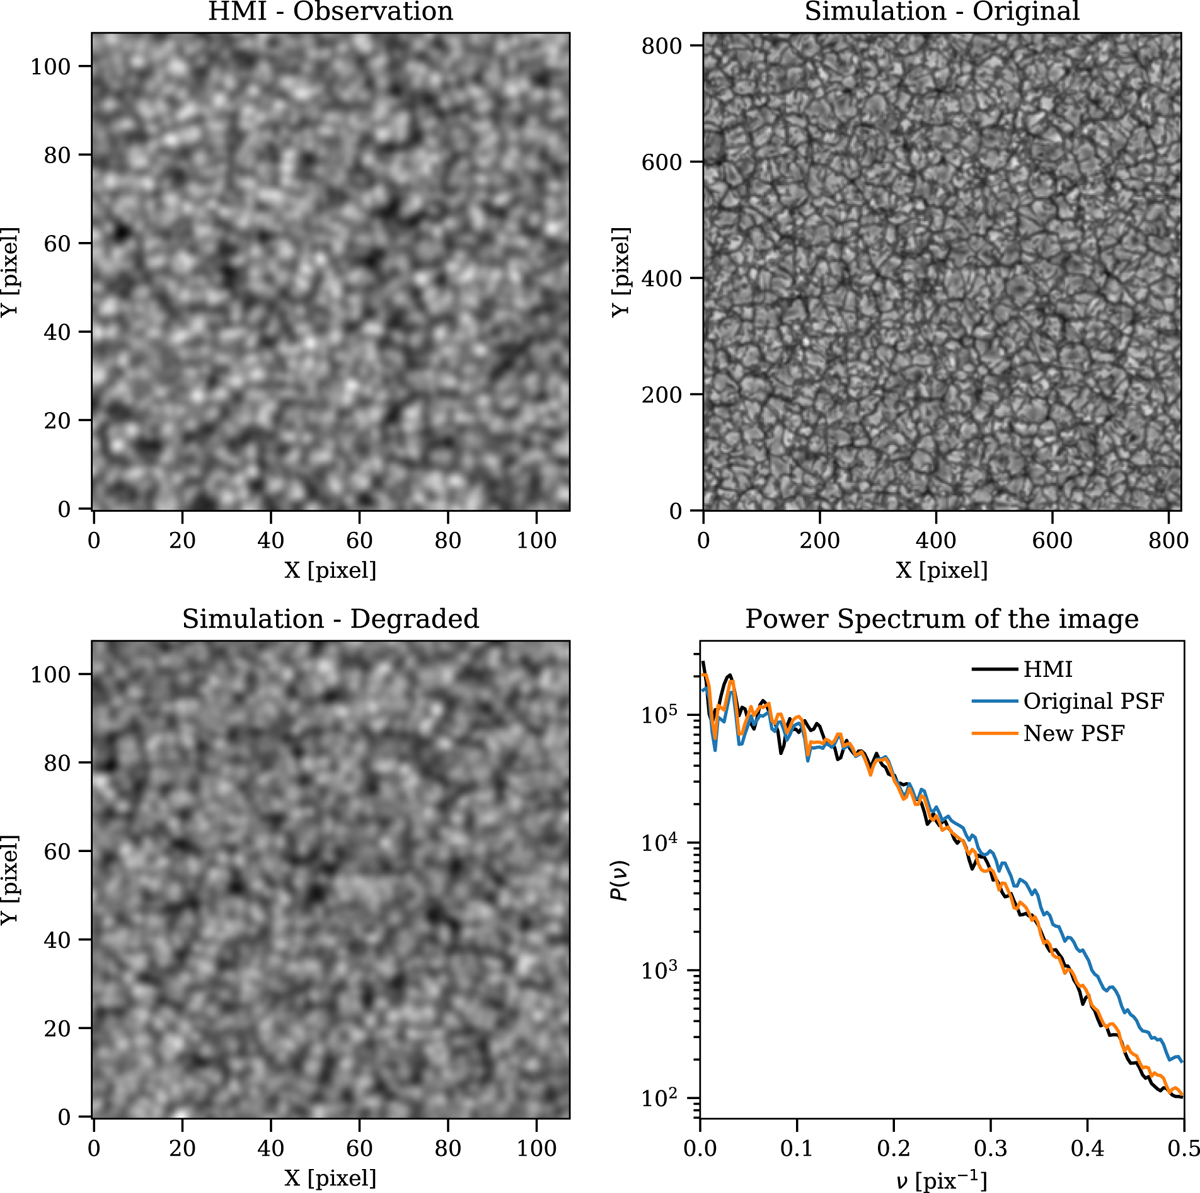
Upper left: HMI observation. Upper right: snapshot from the simulation used for training. Lower left: degraded simulations, which can be compared with the HMI observations. Lower right: azimuthally averaged power spectrum of the HMI observations and the degraded simulations with the original PSF and the one modified and used in the training process. The physical dimension of the three maps is 54′′ × 54′′.
Current usage metrics show cumulative count of Article Views (full-text article views including HTML views, PDF and ePub downloads, according to the available data) and Abstracts Views on Vision4Press platform.
Data correspond to usage on the plateform after 2015. The current usage metrics is available 48-96 hours after online publication and is updated daily on week days.
Initial download of the metrics may take a while.