Fig. 8
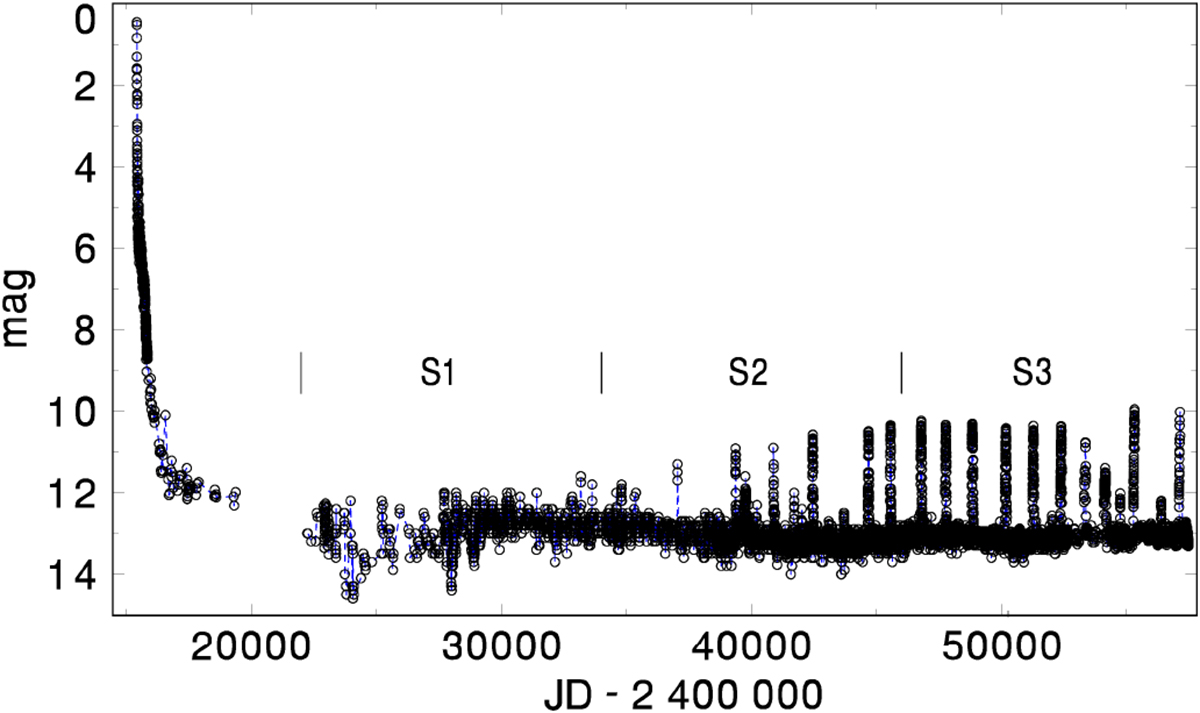
Long-term activity of GK Per (AAVSO data Kafka 2016). The one-day means are used. After the return to quiescence from the classical nova outburst (1901), the initial nova-like activity was followed by a series of DN outbursts. The points represent the one-day means and were connected by a line in the densely observed parts of the light curves to guide the eye. The vertical lines mark the borders of three segments (S1, S2, S3; see Sect. 3.3 for details).
Current usage metrics show cumulative count of Article Views (full-text article views including HTML views, PDF and ePub downloads, according to the available data) and Abstracts Views on Vision4Press platform.
Data correspond to usage on the plateform after 2015. The current usage metrics is available 48-96 hours after online publication and is updated daily on week days.
Initial download of the metrics may take a while.