Fig. 6
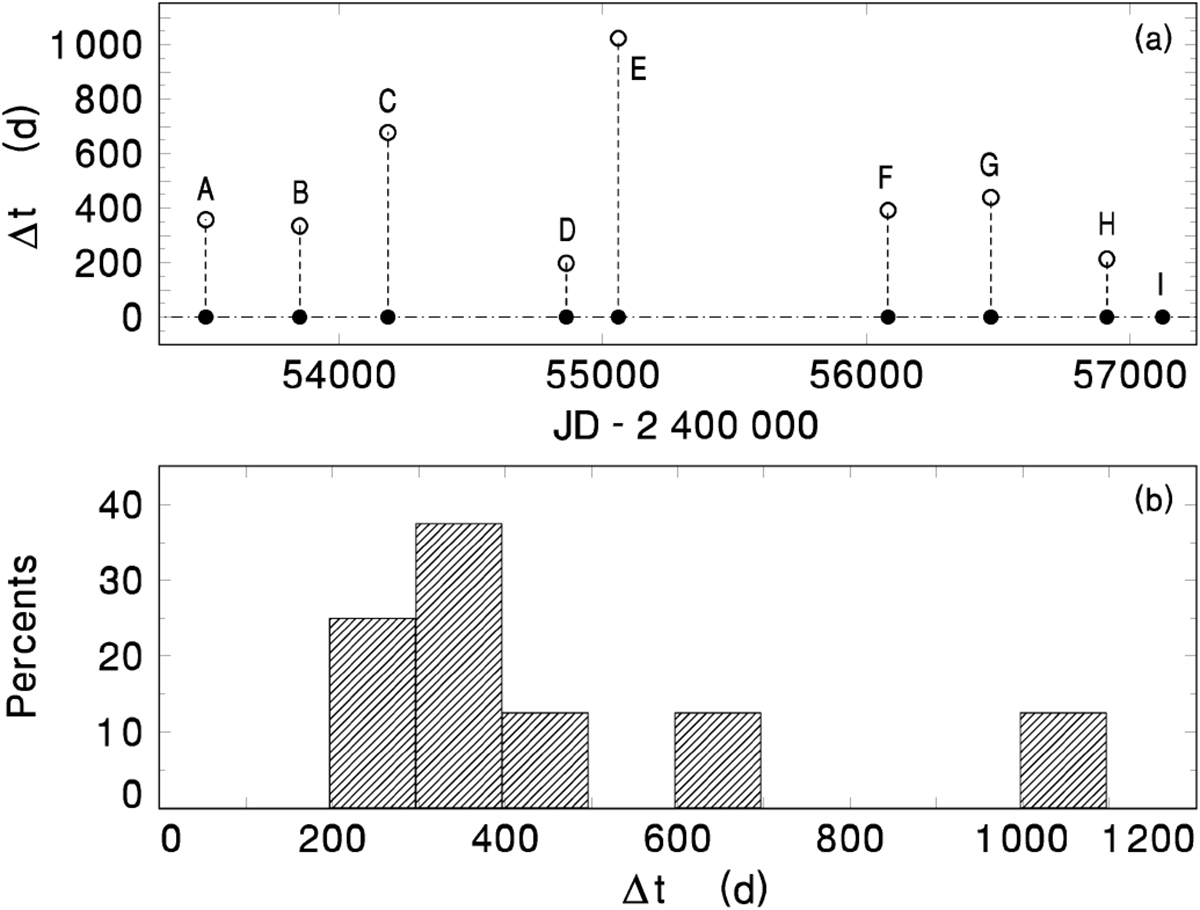
Panel a: times of the observed outbursts in X Ser, marked in Fig. 3e,g. The horizontal line marksthe times of the outbursts (solid circles). The associated open circles denote the time between the specific outburst (marked by the solid circle) and the time elapsing to the subsequent observed outburst. Panel b: histogram of the times between the neighboring observed outbursts (see Sect. 3.2 for details).
Current usage metrics show cumulative count of Article Views (full-text article views including HTML views, PDF and ePub downloads, according to the available data) and Abstracts Views on Vision4Press platform.
Data correspond to usage on the plateform after 2015. The current usage metrics is available 48-96 hours after online publication and is updated daily on week days.
Initial download of the metrics may take a while.