Fig. 5
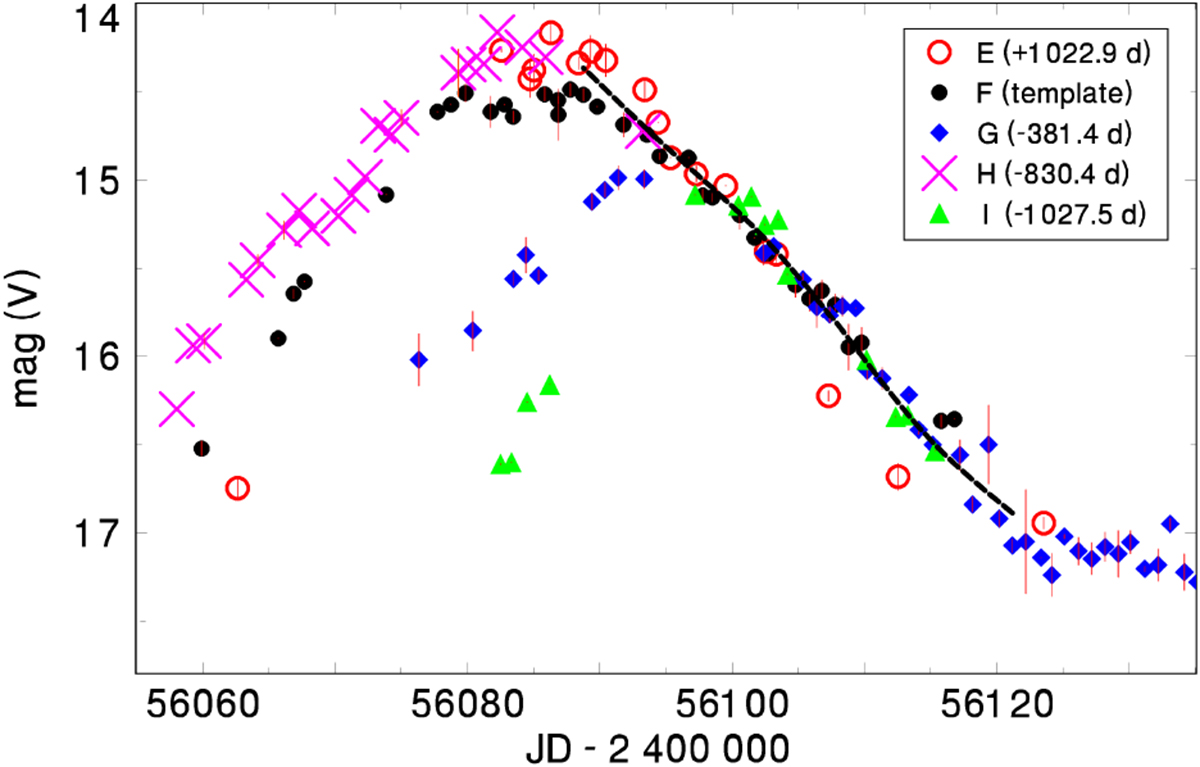
Comparison of the outbursts in X Ser during the post-nova stage. The individual outbursts were shifted along the time axis to match the decaying branch of the template. The time of crossing 15.5 mag(V) and the time shifts with respect to the template are listed. The thick dashed curve represents the smoothed curve of the decaying branch.
Current usage metrics show cumulative count of Article Views (full-text article views including HTML views, PDF and ePub downloads, according to the available data) and Abstracts Views on Vision4Press platform.
Data correspond to usage on the plateform after 2015. The current usage metrics is available 48-96 hours after online publication and is updated daily on week days.
Initial download of the metrics may take a while.