Fig. 4
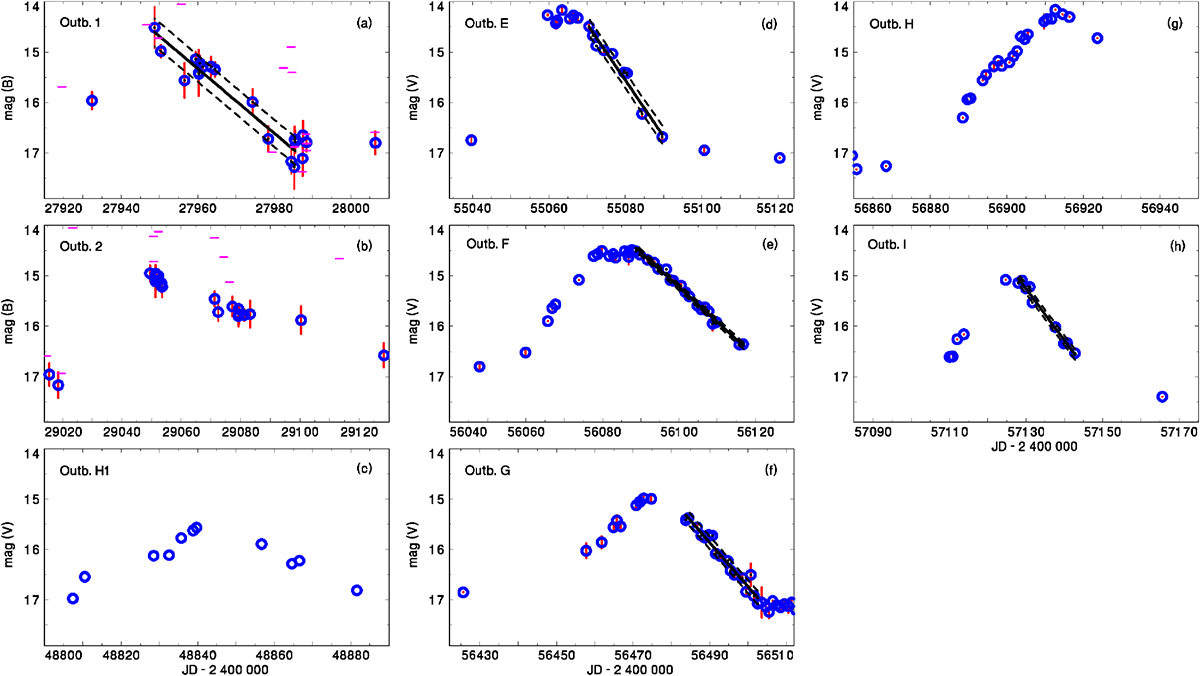
Episodic brightenings (outbursts) of X Ser. Panels a and b: DASCH photographic light curves. The short horizontal lines represent the upper limits of brightness. Panel c: stunted outburst observed by Honeycutt et al. (1998). Panels d–i: CCD V -band AAVSO andCatalina data. The error bars of the AAVSO and Catalina data mark the standard deviation of the one-day mean of brightness. Solid lines mark the fits to those parts of the decaying branches that can be considered linear. The standard deviations of these fits are included. The scales of the horizontal axes are identical for all cases except outburst 2 (panel b).
Current usage metrics show cumulative count of Article Views (full-text article views including HTML views, PDF and ePub downloads, according to the available data) and Abstracts Views on Vision4Press platform.
Data correspond to usage on the plateform after 2015. The current usage metrics is available 48-96 hours after online publication and is updated daily on week days.
Initial download of the metrics may take a while.