Fig. 3
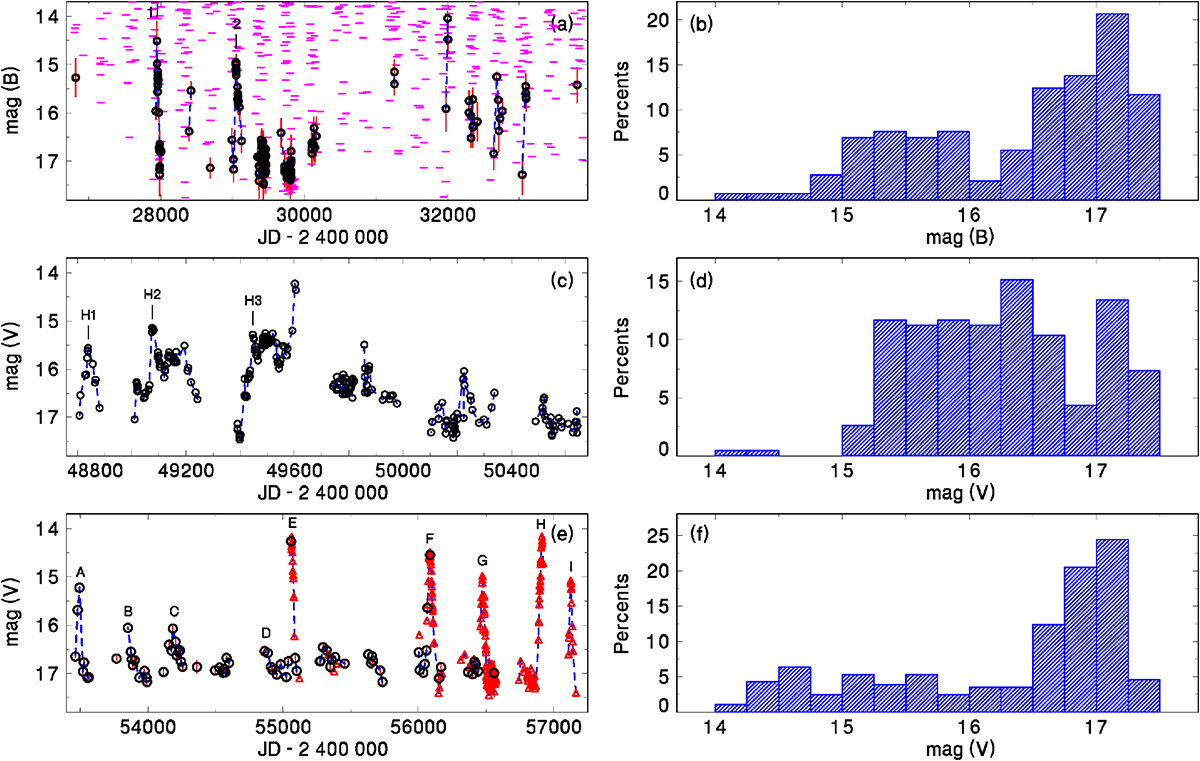
Individual data sets of photometry of the post-nova X Ser. Panel a: photographic DASCH data (1932–1951). The events similar to those in Panel e are labeled 1 and 2. The short horizontal lines represent the upper limits of brightness. Panel b: histogram of brightness of the photographic data. Panel c: light curve from RoboScope (the V -band CCD data; 1992–1997; Honeycutt et al. 1998). The stunted outbursts are labeled H1, H2, and H3. Panel d: histogram of brightness of the RoboScope data. Panel e: light curve from Catalina Survey (2005–2013; circles) and CCD V -band AAVSO data (2009–2015; triangles). The outbursts investigated in Sect. 3.2 are labeled A to I. Panel f: histogram of brightness of the Catalina and AAVSO data (see Sect. 3 for details).
Current usage metrics show cumulative count of Article Views (full-text article views including HTML views, PDF and ePub downloads, according to the available data) and Abstracts Views on Vision4Press platform.
Data correspond to usage on the plateform after 2015. The current usage metrics is available 48-96 hours after online publication and is updated daily on week days.
Initial download of the metrics may take a while.