Free Access
Fig. 2
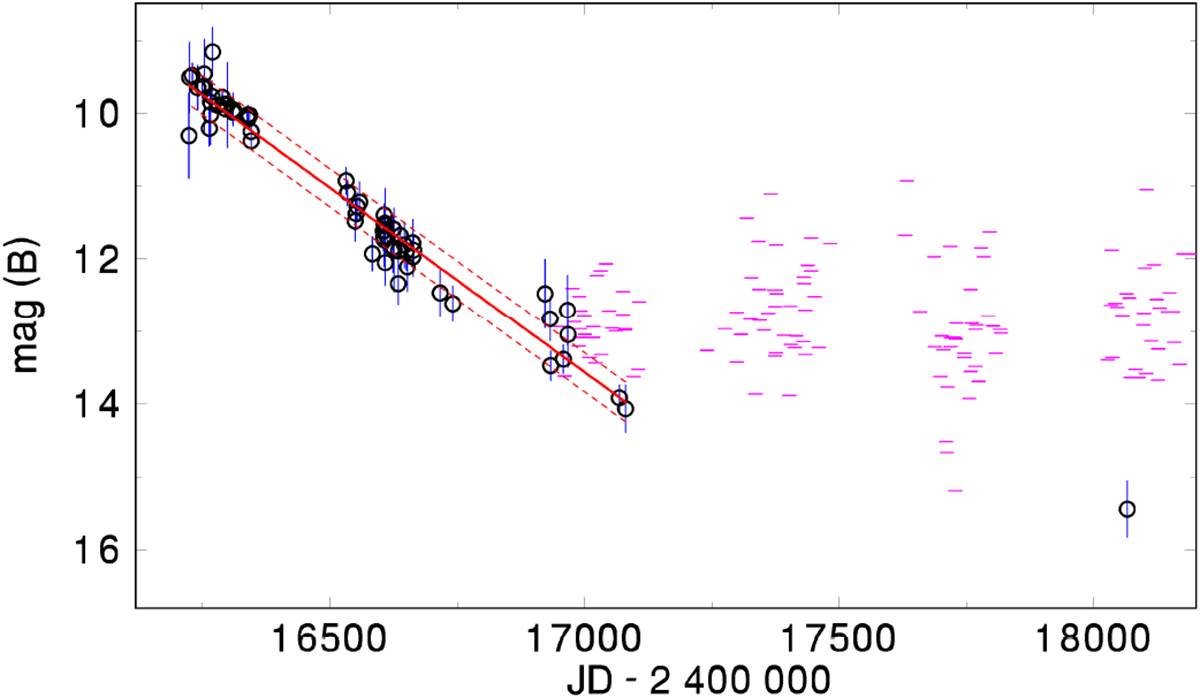
Decaying branch of the classical nova outburst of X Ser (DASCH database). The standard deviations of brightness are shown. The short horizontal lines represent the upper limits of brightness. A linear fit of the decay and its standard deviation are also displayed (see Sect. 3 for details).
Current usage metrics show cumulative count of Article Views (full-text article views including HTML views, PDF and ePub downloads, according to the available data) and Abstracts Views on Vision4Press platform.
Data correspond to usage on the plateform after 2015. The current usage metrics is available 48-96 hours after online publication and is updated daily on week days.
Initial download of the metrics may take a while.