Fig. 10
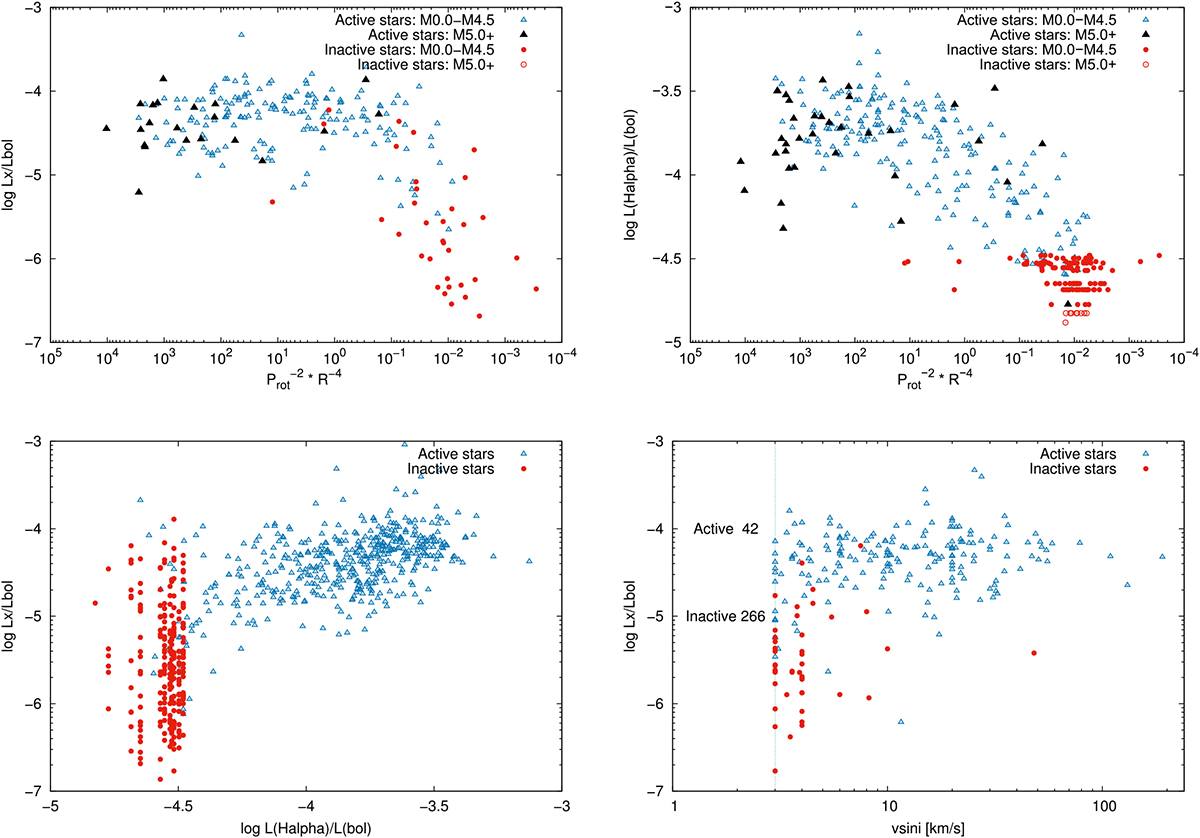
Activity-rotation relation using the generalised Rossby scaling from Reiners et al. (2014) for (upper left panel) LX /Lbol and (upper right panel) normalised Hα luminosity. The lower left plot shows the correlation of LX/Lbol and normalised Hα luminosity and the lower right plots shows the correlation of LX/Lbol with v sini, where only detectable vsini values are shown and the number of points not plotted is shown. For Hα inactive stars, the value of LHα∕Lbol where the numbers are placed in the figures are at the LHα∕Lbol values that correspond to the detection limit of pEW(Hα) = −0.5Å.
Current usage metrics show cumulative count of Article Views (full-text article views including HTML views, PDF and ePub downloads, according to the available data) and Abstracts Views on Vision4Press platform.
Data correspond to usage on the plateform after 2015. The current usage metrics is available 48-96 hours after online publication and is updated daily on week days.
Initial download of the metrics may take a while.