Fig. A.6
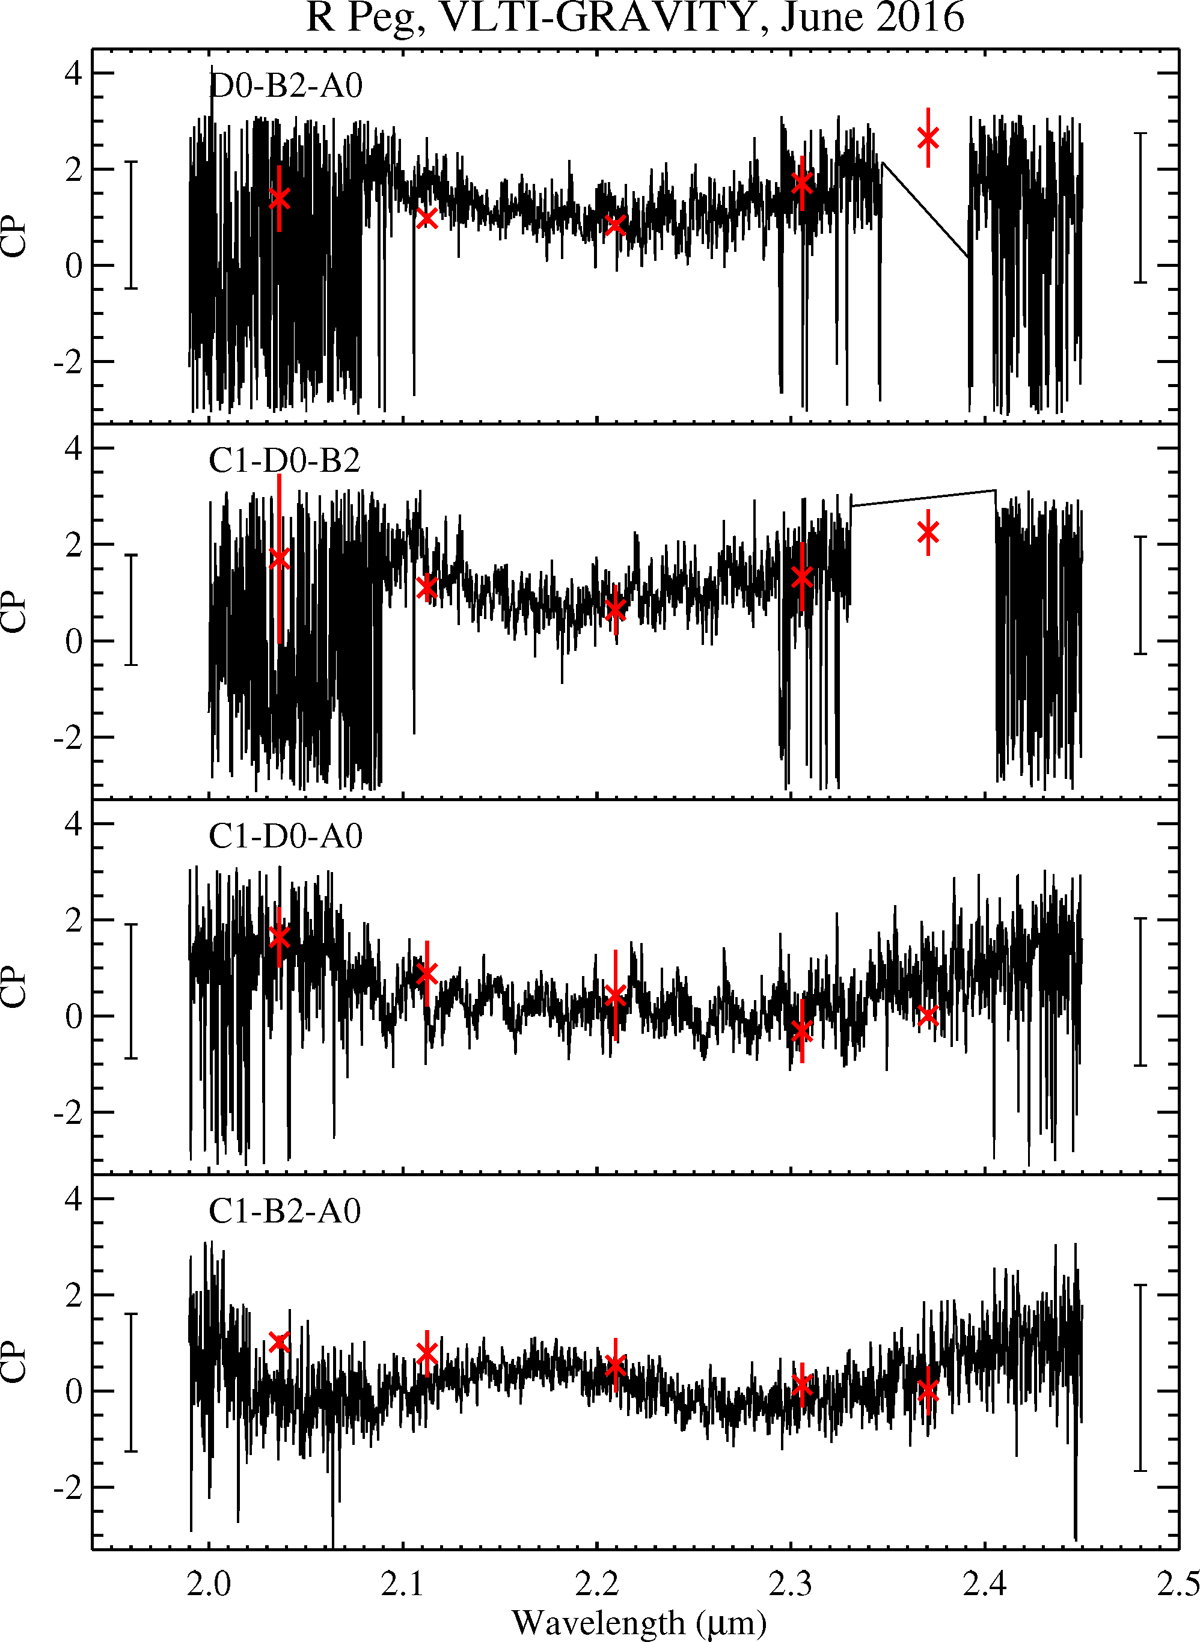
R Peg closure phase obtained in June 2016. The black lines denote the closure phases measured on the science camera. The errors are indicated by mean values and their errors on each side of the plot for the first and second half of the wavelength interval. The red points with error bars denote the closure phases measured on the fringe tracker camera with low spectral resolution.
Current usage metrics show cumulative count of Article Views (full-text article views including HTML views, PDF and ePub downloads, according to the available data) and Abstracts Views on Vision4Press platform.
Data correspond to usage on the plateform after 2015. The current usage metrics is available 48-96 hours after online publication and is updated daily on week days.
Initial download of the metrics may take a while.