Free Access
Fig. A.1
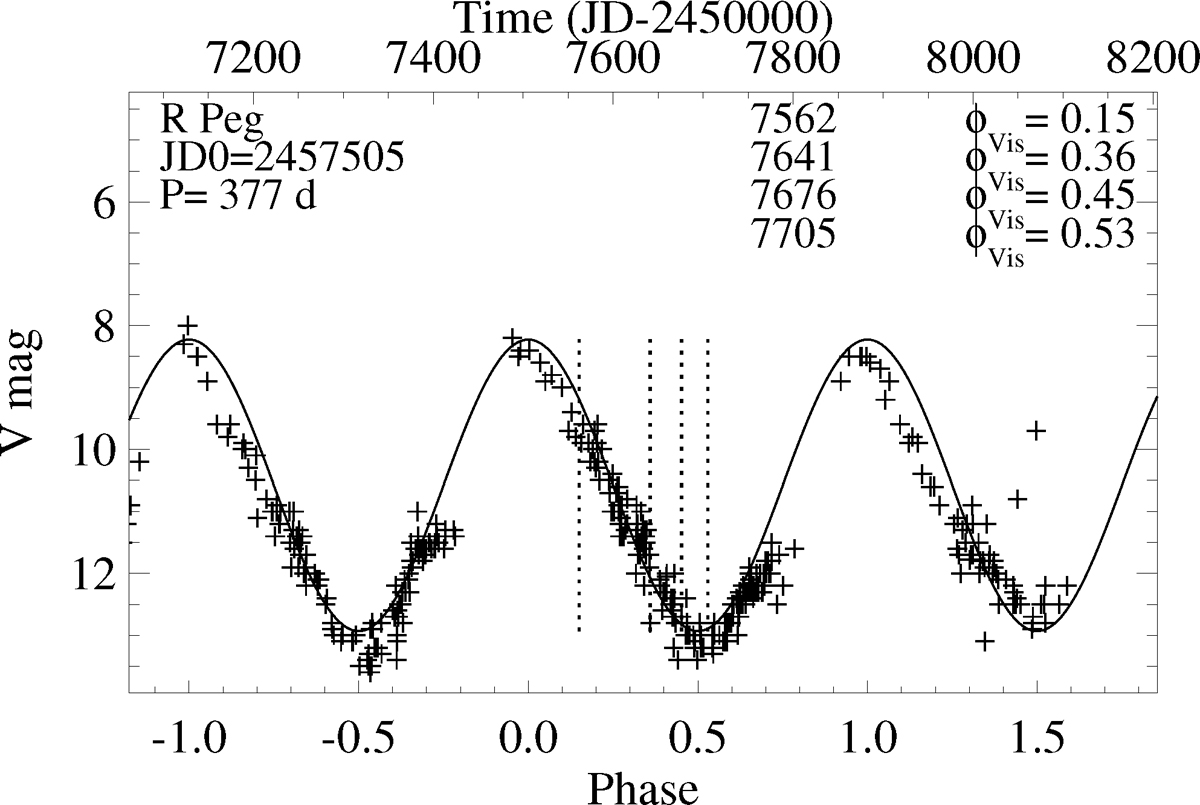
Visual lightcurve of R Peg based on the AAVSO and AFOEV databases. The solid line represents a sine fit to the ten most recent cycles. The dashed vertical lines denote the epochs of our observations.
Current usage metrics show cumulative count of Article Views (full-text article views including HTML views, PDF and ePub downloads, according to the available data) and Abstracts Views on Vision4Press platform.
Data correspond to usage on the plateform after 2015. The current usage metrics is available 48-96 hours after online publication and is updated daily on week days.
Initial download of the metrics may take a while.