Fig. 1
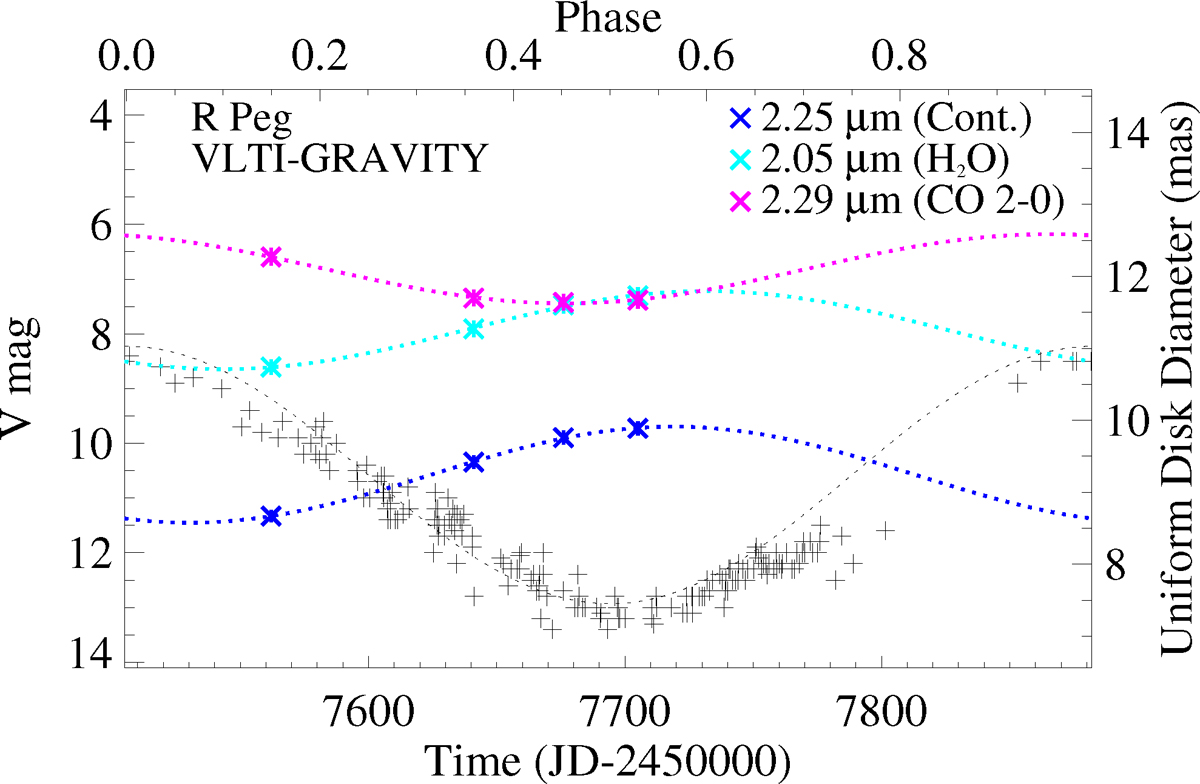
Variability in the V magnitude and in the UD angular diameters in the near-continuum band, and in bands dominated by H2O (2.05 μm) and CO 2–0 (2.29 μm). Also shown are sinusoidal fit results. The minimum continuum size tracks the maximum light, which can be understood by the increasing effective temperature when the star gets smaller. The minimum contribution of H2O tracks the maximum light as well, which can be understood as the destruction of water vapour at maximum light and formation at minimum light. The contribution from CO instead is greatest at maximum light, indicating a different and more stable behaviour of CO compared to water vapour.
Current usage metrics show cumulative count of Article Views (full-text article views including HTML views, PDF and ePub downloads, according to the available data) and Abstracts Views on Vision4Press platform.
Data correspond to usage on the plateform after 2015. The current usage metrics is available 48-96 hours after online publication and is updated daily on week days.
Initial download of the metrics may take a while.