Free Access
Fig. 5
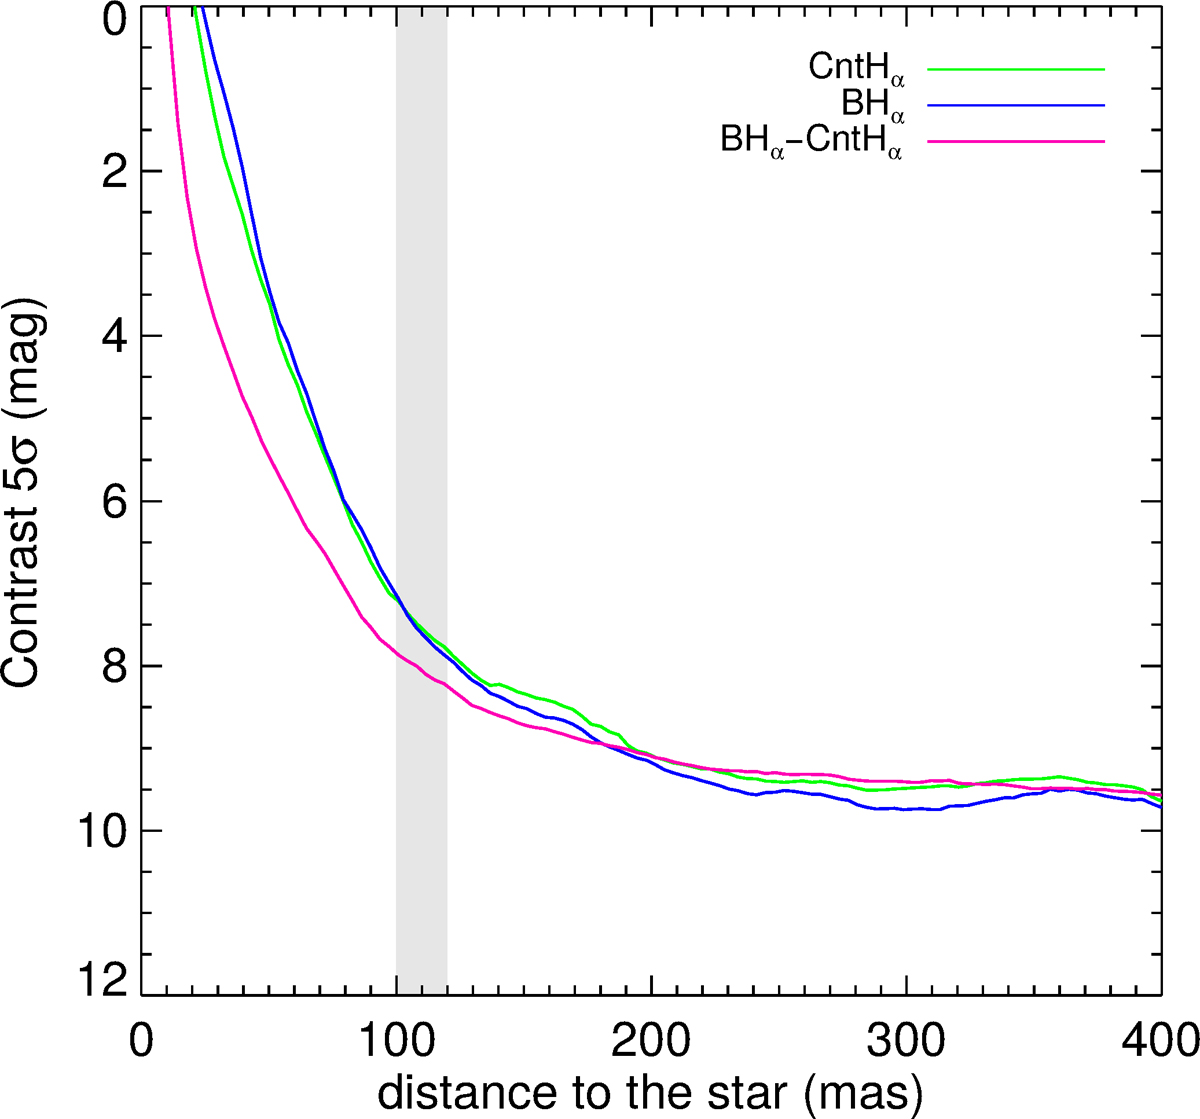
VLT/ZIMPOL 5σ contrast curves obtained in Cnt_Ha and B_Ha in ADI using PCA, and in B_Ha-Cnt_Ha in ASDI using PCA. The gray area shows the position of the companion candidate detected at L′ by Reggiani et al. (2018). The curves are derived using the best 47 images.
Current usage metrics show cumulative count of Article Views (full-text article views including HTML views, PDF and ePub downloads, according to the available data) and Abstracts Views on Vision4Press platform.
Data correspond to usage on the plateform after 2015. The current usage metrics is available 48-96 hours after online publication and is updated daily on week days.
Initial download of the metrics may take a while.