Free Access
Fig. 3
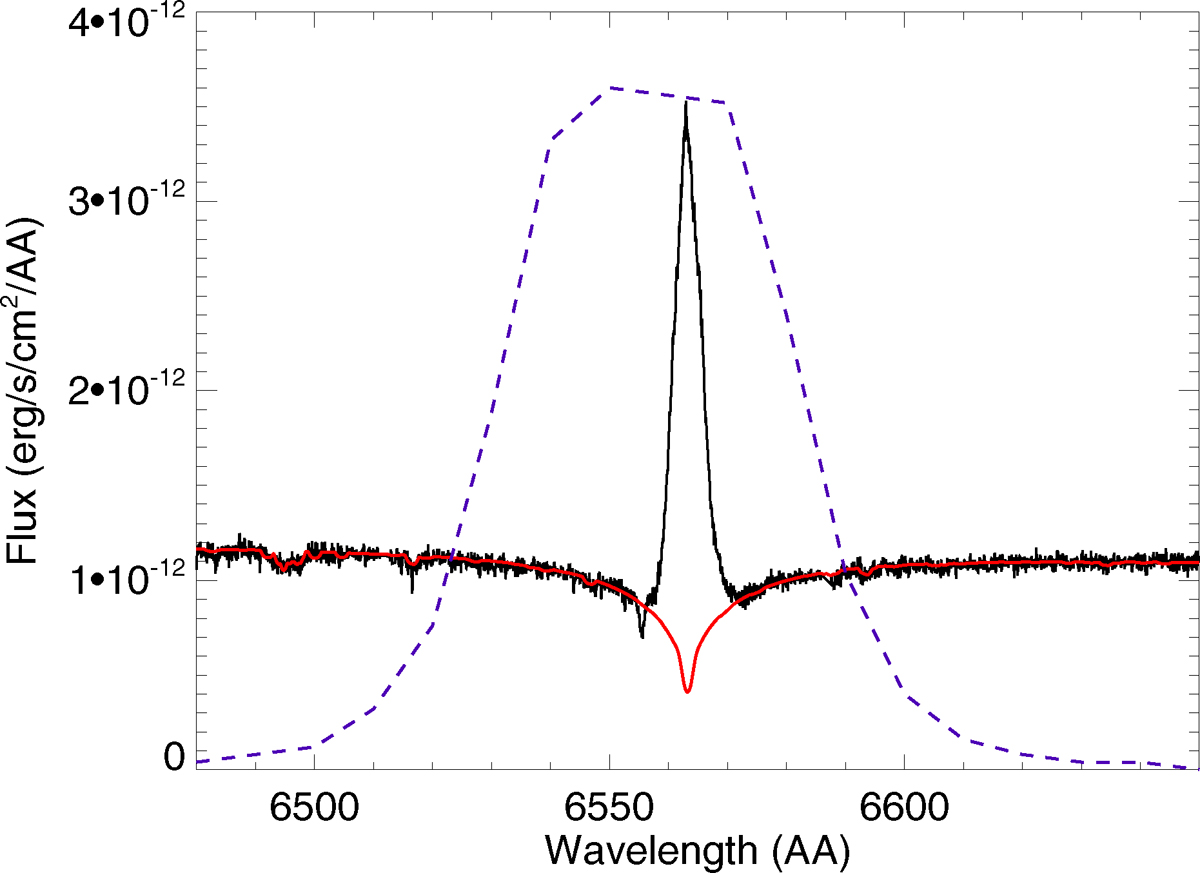
The observed CAFE/CAHA spectrum around the Hα line (in black). The red line represents the model used to fit the stellar atmosphere (see text). The dashed blue line represents the ZIMPOL B_Ha filter transmission curve.
Current usage metrics show cumulative count of Article Views (full-text article views including HTML views, PDF and ePub downloads, according to the available data) and Abstracts Views on Vision4Press platform.
Data correspond to usage on the plateform after 2015. The current usage metrics is available 48-96 hours after online publication and is updated daily on week days.
Initial download of the metrics may take a while.