Fig. 1
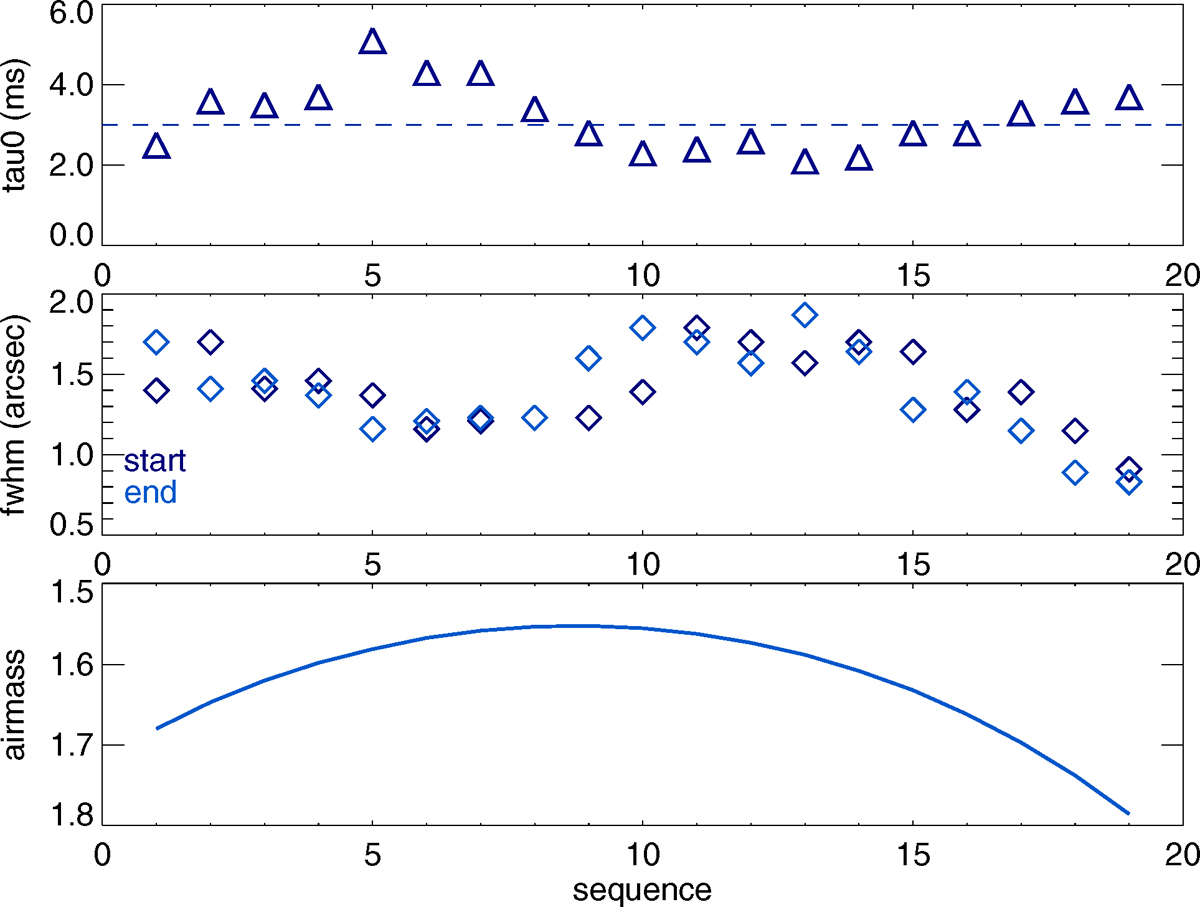
Average atmospheric conditions during the ZIMPOL observations. The x-axis shows the average conditions in cycles of 10 min. Therefore, we have represented 19 cycles of 10 min each. From top to bottom, we have plotted the coherence time (τ0), the average FWHM as seen by the guide probe at the beginning and end of the cycles, and the airmass.
Current usage metrics show cumulative count of Article Views (full-text article views including HTML views, PDF and ePub downloads, according to the available data) and Abstracts Views on Vision4Press platform.
Data correspond to usage on the plateform after 2015. The current usage metrics is available 48-96 hours after online publication and is updated daily on week days.
Initial download of the metrics may take a while.