Fig. 5
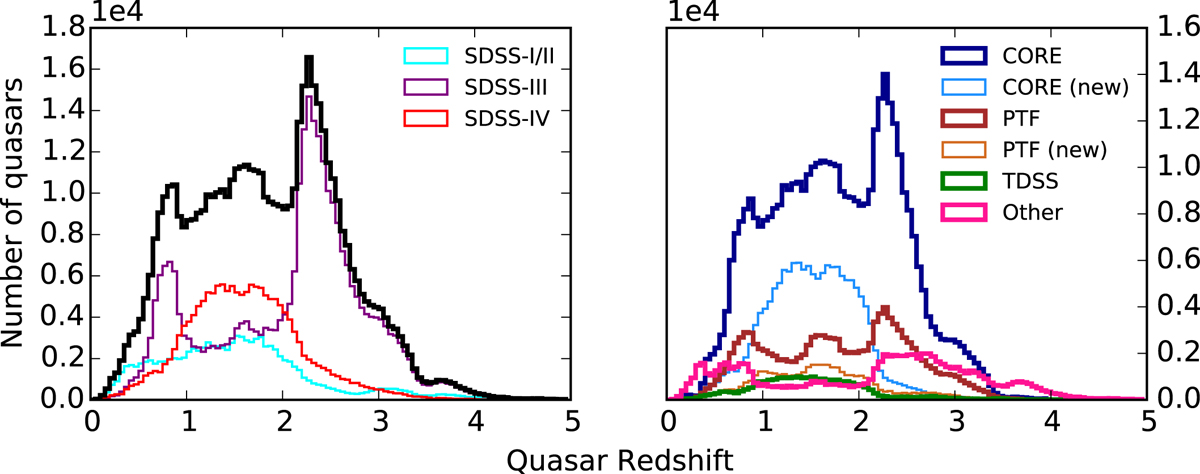
Leftpanel: redshift distribution of DR14Q quasars (black thick histogram) in the range 0 ≤ z ≤ 5. The redshift distribution of quasars observed as part of SDSS-I/II is shown with a cyan histogram. The redshift distributions of quasars observed as part of SDSS-III (purple histogram) and SDSS-IV (red histogram) are also displayed. Right panel: redshift distributions of all CORE quasars that are part of DR14Q (dark blue histogram), CORE quasars observed as part of SDSS-IV/eBOSS (light blue histogram), all PTF quasars (brown histogram), PTF quasars observed as part of SDSS-IV/eBOSS (orange histogram), SDSS-IV/TDSS quasars (green histogram) and quasars observed as part of ancillary programs (pink histogram). Some quasars can be selected by several target selection algorithms, hence the cumulative number of quasars in a single redshift bin can exceed the total number in that bin. The bin size for both panels is Δ z = 0.05.
Current usage metrics show cumulative count of Article Views (full-text article views including HTML views, PDF and ePub downloads, according to the available data) and Abstracts Views on Vision4Press platform.
Data correspond to usage on the plateform after 2015. The current usage metrics is available 48-96 hours after online publication and is updated daily on week days.
Initial download of the metrics may take a while.