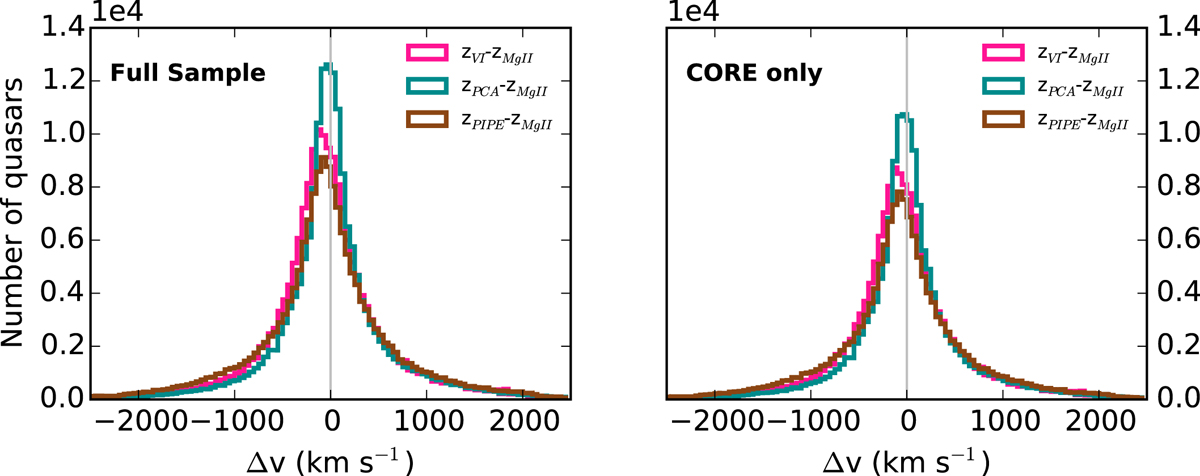
Fig. 3
Left panel: distribution of velocity differences between Z_VI (magenta histogram), Z_PIPE (brown histogram), Z_PCA (dark cyan histogram) and Z_MGII. These histograms are computed using 178 981 quasars that have all the four redshift estimates available in DR14Q. Right panel: same as left panel restricted to the 151 701 CORE quasars for which we have the four redshift estimates available in DR14Q. In both panels, the histograms are computed in bins of Δ v = 50 km s−1 and the vertical grey line marks Δv = 0 km s−1.
Current usage metrics show cumulative count of Article Views (full-text article views including HTML views, PDF and ePub downloads, according to the available data) and Abstracts Views on Vision4Press platform.
Data correspond to usage on the plateform after 2015. The current usage metrics is available 48-96 hours after online publication and is updated daily on week days.
Initial download of the metrics may take a while.