Fig. 1
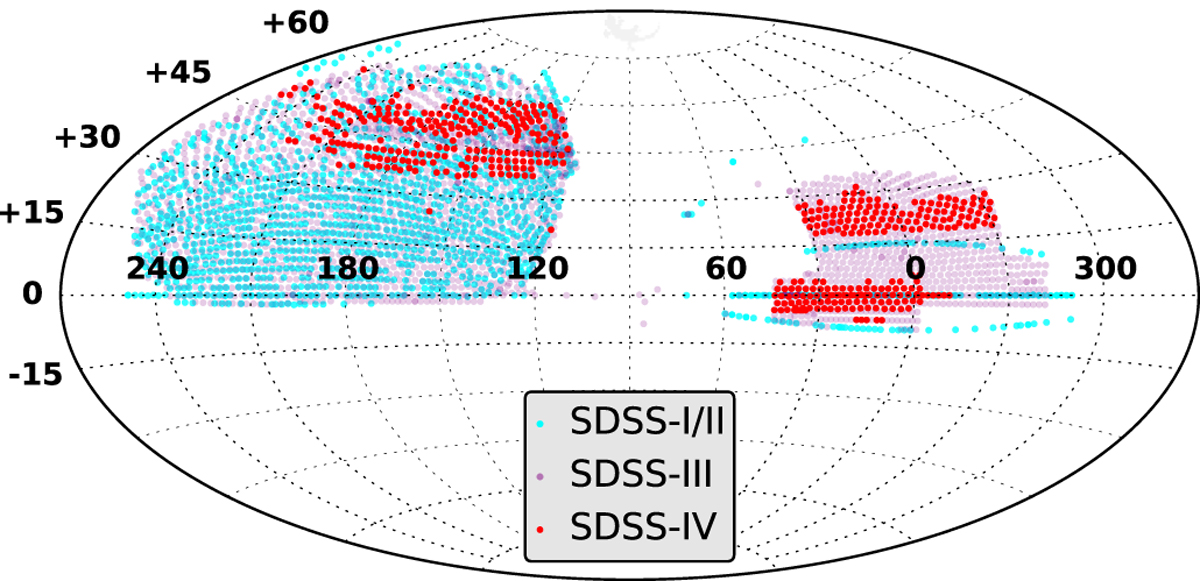
Distribution on the sky of the SDSS-DR14/eBOSS spectroscopy in J2000 equatorial coordinates (expressed in decimal degrees). Cyan dots correspond to the 1462 plates observed as part of SDSS-I/II. The purple area indicates the 2587 plates observed as part of SDSS-III/BOSS. The red area represents to the 496 new plates observed as part of SDSS-IV (i.e. with MJD ≥ 56 898).
Current usage metrics show cumulative count of Article Views (full-text article views including HTML views, PDF and ePub downloads, according to the available data) and Abstracts Views on Vision4Press platform.
Data correspond to usage on the plateform after 2015. The current usage metrics is available 48-96 hours after online publication and is updated daily on week days.
Initial download of the metrics may take a while.