Fig. 2
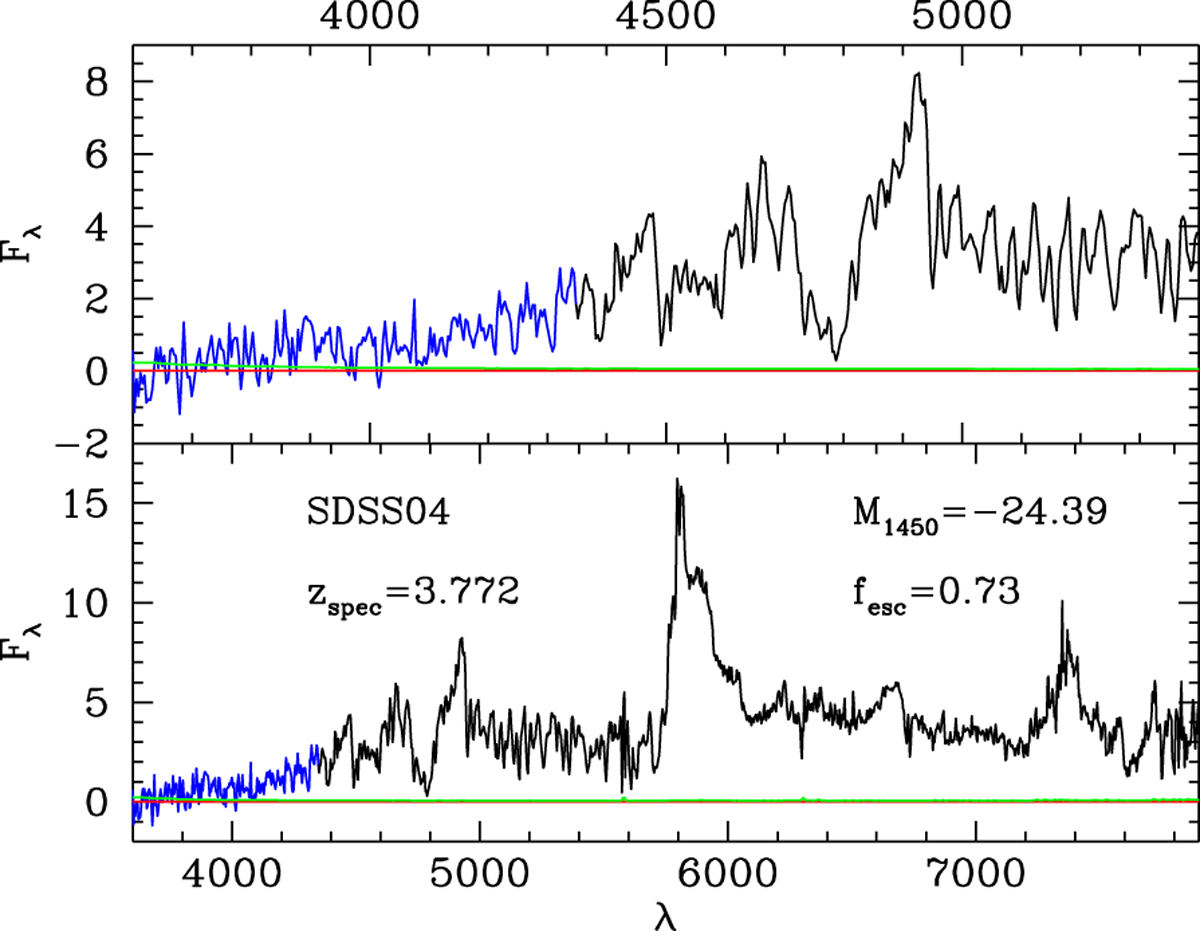
Bottom: UV/optical spectrum of the AGN SDSS04 observed by FORS2 at VLT. Top: a zoom of the blue side of the spectrum for AGN SDSS04. The red horizontal lines mark the zero level for the flux Fλ, in arbitrary units. The LyC region (at λ ≤ 912 Å rest frame) has been highlighted in blue. The associated RMS is shown by the green spectrum.
Current usage metrics show cumulative count of Article Views (full-text article views including HTML views, PDF and ePub downloads, according to the available data) and Abstracts Views on Vision4Press platform.
Data correspond to usage on the plateform after 2015. The current usage metrics is available 48-96 hours after online publication and is updated daily on week days.
Initial download of the metrics may take a while.