Fig. 19
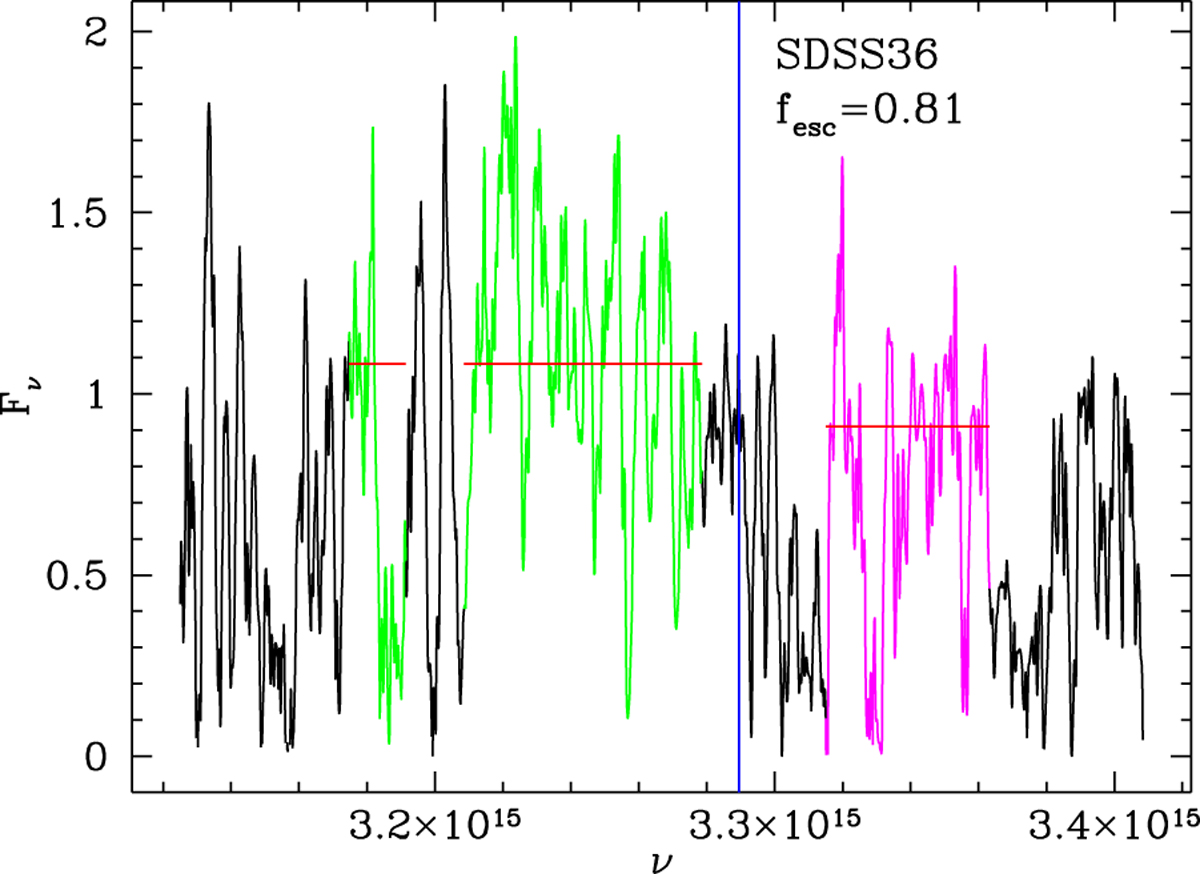
Estimate of the LyC escape fraction for the AGN SDSS36 observed with MODS1-2 at the LBT telescope. The spectrum is in Fν and is arbitrarily normalized and blueshifted to z = 0 (rest-frame frequencies). The green portion of the spectrum shows the spectral region between 915 and 945 Å rest frame (excluding the wavelength range 935-940 Å due to the presence of the Lyman-ϵ emission line), while the magenta portion indicates the ionizing photons emitted between 892 and 905 Å rest frame. The blue vertical line indicates the location of the 912 Å rest-frame break. The red horizontal lines mark the mean values above and below the Lyman limit, after the iterative 2-σ clipping. The resulting escape fraction is the ratio between these two mean fluxes, and turns out to be 81% for SDSS36.
Current usage metrics show cumulative count of Article Views (full-text article views including HTML views, PDF and ePub downloads, according to the available data) and Abstracts Views on Vision4Press platform.
Data correspond to usage on the plateform after 2015. The current usage metrics is available 48-96 hours after online publication and is updated daily on week days.
Initial download of the metrics may take a while.