Fig. 9
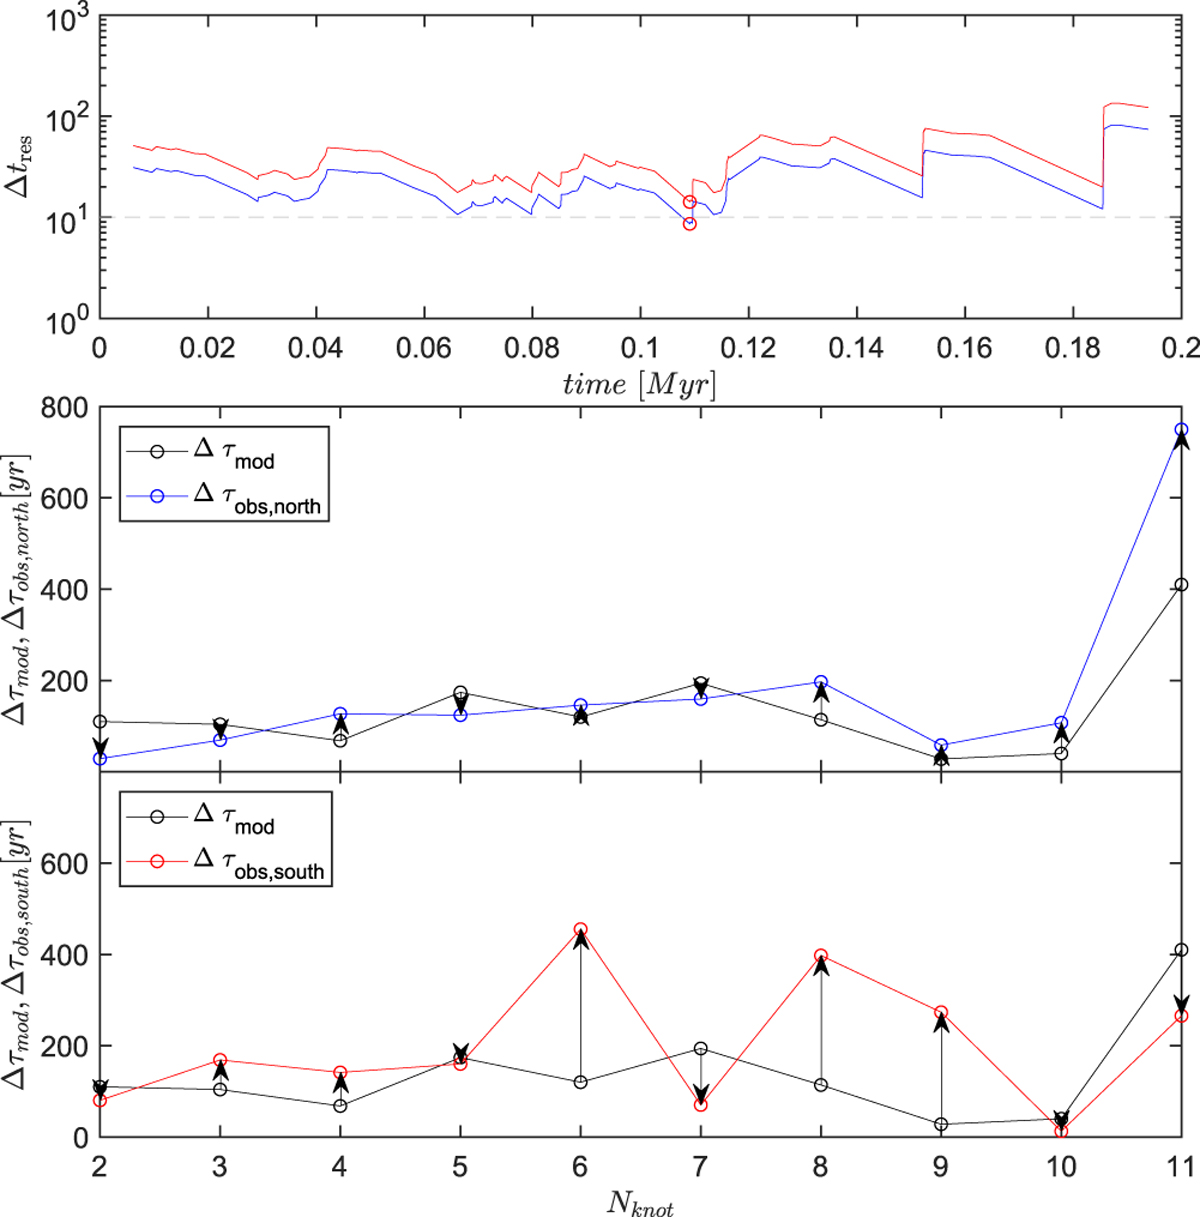
Top panel: residual times left after subtracting the observed sequences of Δτobs from the model sequence of Δτmod in model 1 and then normalized to the maximum dynamical timescale of the knots in CARMA 7. The blue and red curves correspond to the northern and southern knots, respectively. The red circles mark the minimum values which correspond to the best fit between the observational and model data. Middle and bottom panels: Δτobs and Δτmod as a function of the knot serial number at the time instance when the best fit between the observed and model data was found. The middle panel provides the comparison for the northern knots, while the bottom panel – for the southern knots. The arrows show the mismatch between the individual data pairs.
Current usage metrics show cumulative count of Article Views (full-text article views including HTML views, PDF and ePub downloads, according to the available data) and Abstracts Views on Vision4Press platform.
Data correspond to usage on the plateform after 2015. The current usage metrics is available 48-96 hours after online publication and is updated daily on week days.
Initial download of the metrics may take a while.