Free Access
Fig. 8
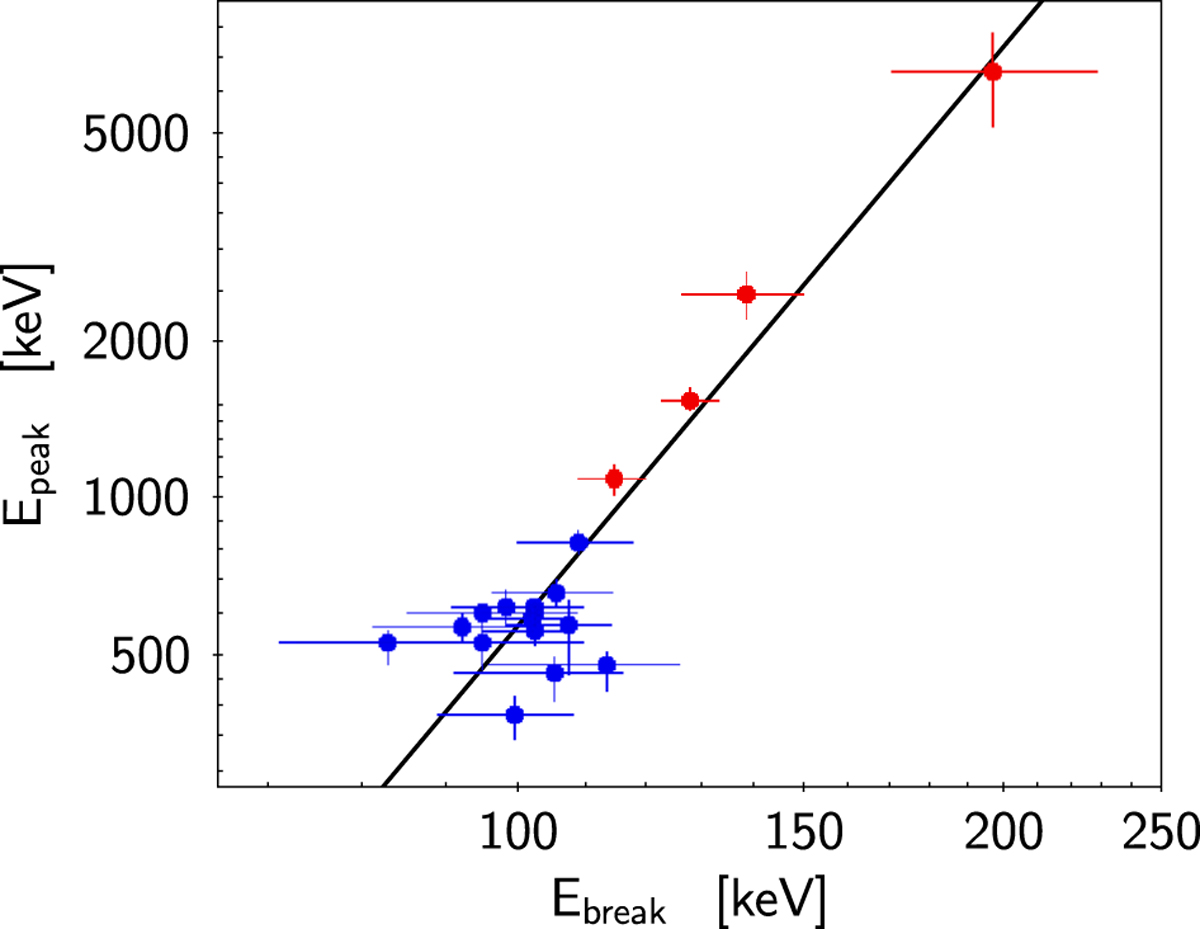
Correlation between the peak energy Epeak and the break energy Ebreak of the 2SBPL model in the time-resolved analysis. The values from the first four time bins are indicated by red symbols, while later times are by blue symbols. Error bars show uncertainties at 1σ.
Current usage metrics show cumulative count of Article Views (full-text article views including HTML views, PDF and ePub downloads, according to the available data) and Abstracts Views on Vision4Press platform.
Data correspond to usage on the plateform after 2015. The current usage metrics is available 48-96 hours after online publication and is updated daily on week days.
Initial download of the metrics may take a while.